January was characterized by lackluster performance across the majority of the cryptocurrency market. Nevertheless, there are emerging signs of recovery, especially as Bitcoin (BTC)seeks to surpass its previous $43,000 threshold, having previously fallen below the $40,000 mark. This pivotal threshold, once a symbol of Bitcoin’s robust market stance, is now the target of its recovery efforts.
In a focused analysis of Shiba Inu (SHIB), there have been noteworthy positive developments. The cryptocurrency has shown encouraging signs through its technical indicators, specifically the TD sequential and its performance against the 200 and 50-day moving averages. These indicators collectively suggest a potential for upward momentum, spotlighting SHIB as a candidate for significant value appreciation.
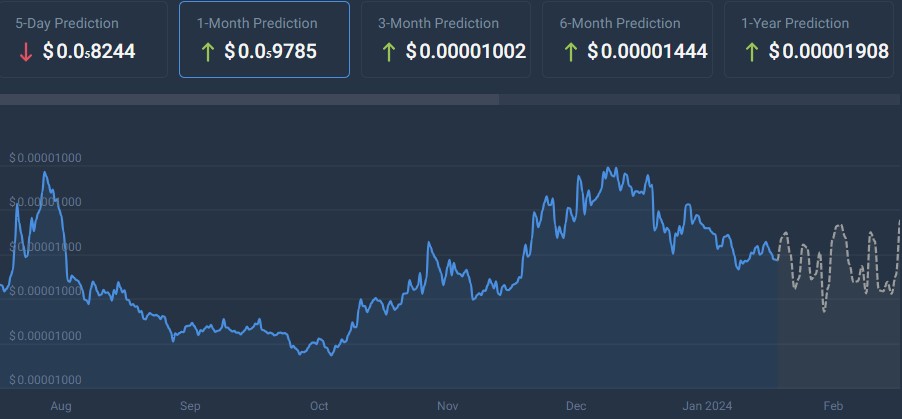
Considering the current circumstances, Finbold consulted an AI-powered machine-learning algorithm in analyzing the expected price of SHIB by the end of this month.

SHIB price prediction for February 29. Source: CoinCodex
According to the algorithms, the projected price for SHIB is expected to decrease to $0.000008137 by February 29, reflecting a -8.61% fall from its present level of $0.000008904.
Analysts predictions
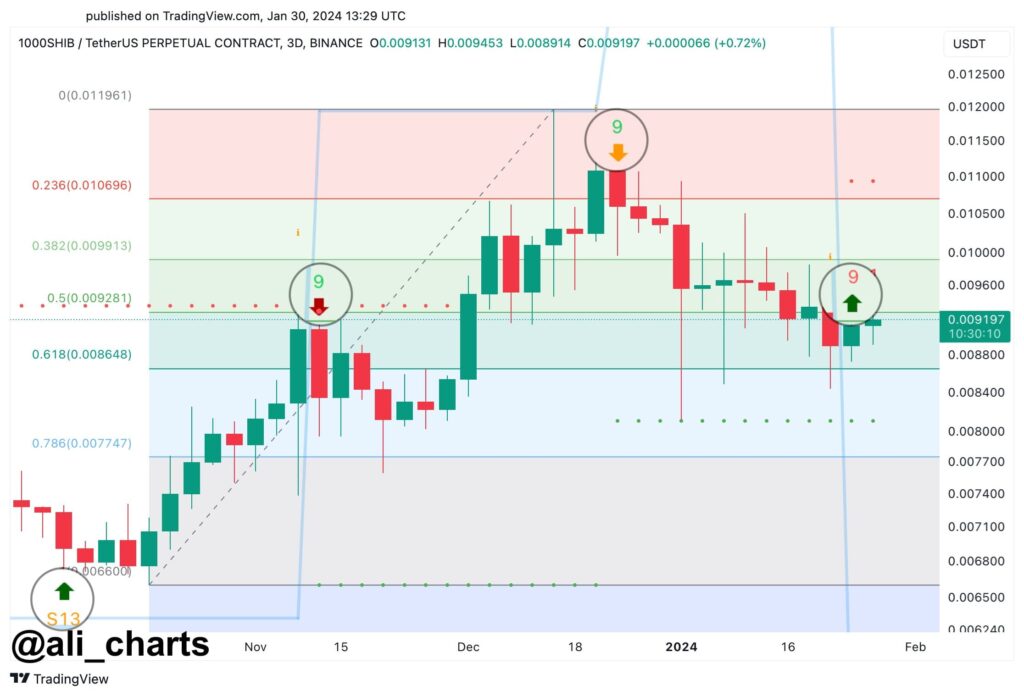
SHIB recently flashed a reversal signal on TD Sequential, which is a robust technical analysis tool crafted to pinpoint the moment of trend exhaustion for traders and anticipate potential price reversals.
In particular, the TD Sequential indicator has demonstrated notable accuracy in forecasting movements in the price of Shiba Inu. It signals a buy, suggesting a potential upward movement for SHIB, per cryptocurrency expert Ali Martinez.
“Keep an eye out, as SHIB could climb to $0.010 or potentially even reach $0.011!”

Potential SHIB trend reversal according to TD Sequential indicator. Source: Ali Martinez
Hence, as the expert indicates a possible ascent to $0.010 or $0.011, he alludes to the contract price for 1,000 SHIB tokens. This implies that the individual token price could reach $0.000010 or $0.000011, respectively.
Looking at the 2-hour chart for Shiba Inu, a downward trend seems to be breaking, indicating a possible increase in price, as per crypto trader SHIB KNIGHT’s post on January 29.
$SHIB is breaking downtrend at 2H Chart pic.twitter.com/XN3R2EjJEm
— $SHIB KNIGHT (@army_shiba) January 29, 2024SHIB price analysis
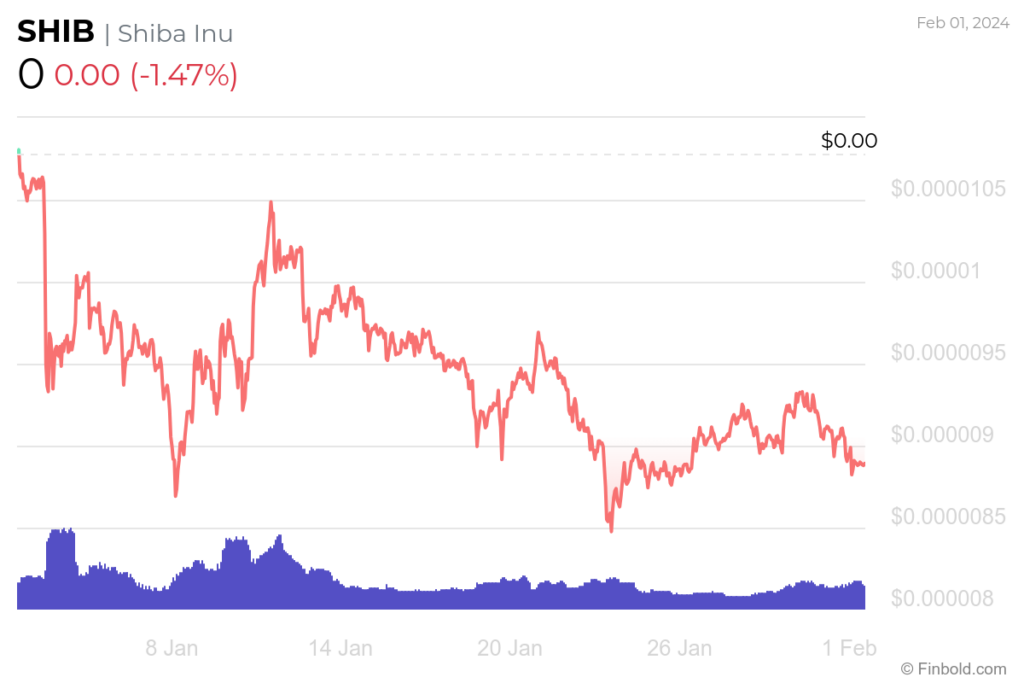
At the time of press, SHIB was trading at $0.000008904, showcasing a decrease of -1.47% in the last 24 hours, contrary to the gain of 0.16%. This crypto has lost -17.72% of its value in the previous month.

SHIB 30-day price chart. Source: Finbold
Technical indicators for SHIB are dominantly bearish at a ‘sell’ rating of 13. Moving averages point to a ‘strong sell’ of 13 as well. However, oscillators point toward a ‘buy’ rating of 2.

Technical analysis of SHIB. Source: TradingView
Whether SHIB will manage to break through its resistance zone and initiate a surge in its price, or whether it will remain in the lows or possibly retrace, remains to be seen.
Disclaimer: The content on this site should not be considered investment advice. Investing is speculative. When investing, your capital is at risk.


