After Bitcoin (BTC) last week initiated a bullish streak that has led it to surpass an important psychological price level at $48,000, further, stronger gains could be in store as the flagship decentralized finance (DeFi) asset has entered a ‘Boom’ phase.
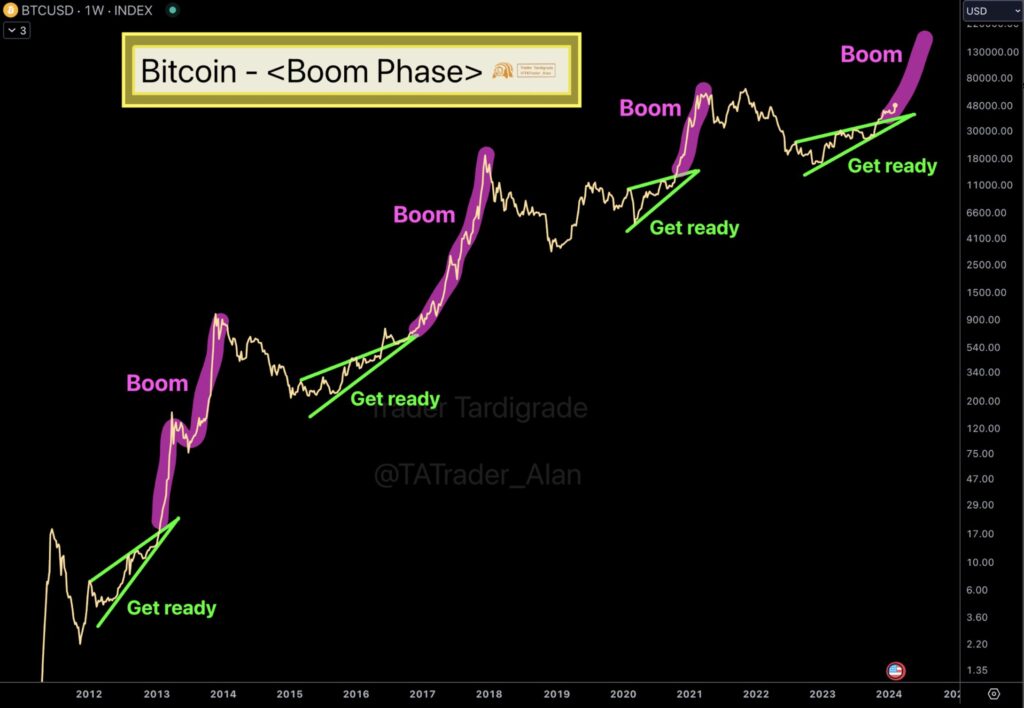
Specifically, Bitcoin has left the “Green Triangle at the ‘Get Ready’ phase” and started its movement in the ‘Boom’ phase, which could send it to $130,000 and beyond this year, according to the analysis shared by pseudonymous cryptocurrency expert Trader Tardigrade in an X post on February 12.

Bitcoin price action analysis. Source: Trader Tardigrade
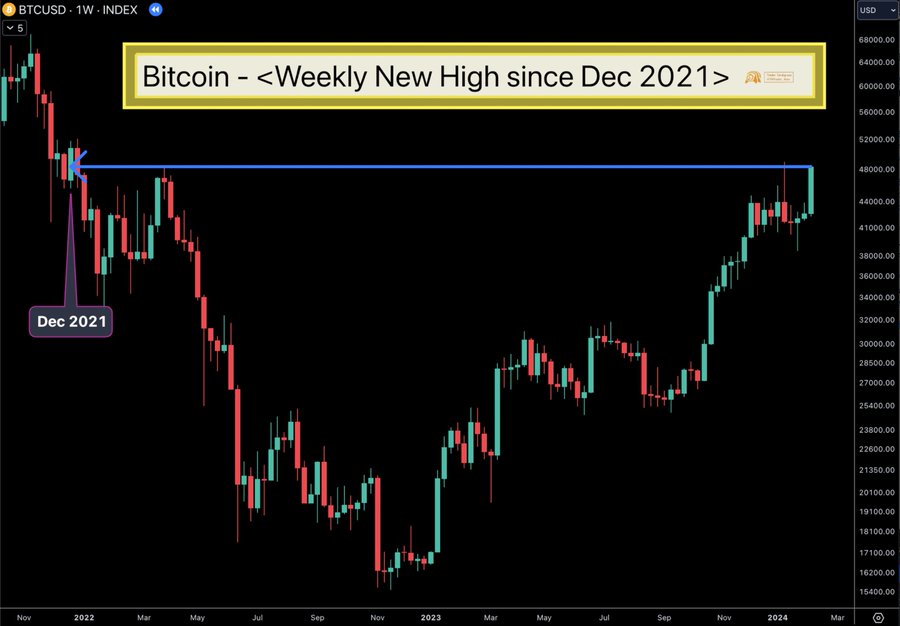
As it happens, this move is taking place as Bitcoin’s weekly candle close has made a new high (in the $48,000 area) for the first time in over two years, or since December 2021, as the crypto trading analyst observed earlier, and illustrated in the accompanying chart patterns.

Bitcoin weekly candle close. Source: Trader Tardigrade
At the same time, renowned crypto analyst Ali Martinez noted on February 11 that Bitcoin’s support levels “remain robust, potentially outweighing resistance,” despite ongoing skepticism regarding the largest asset in the crypto sector by market capitalization. As he further explained:
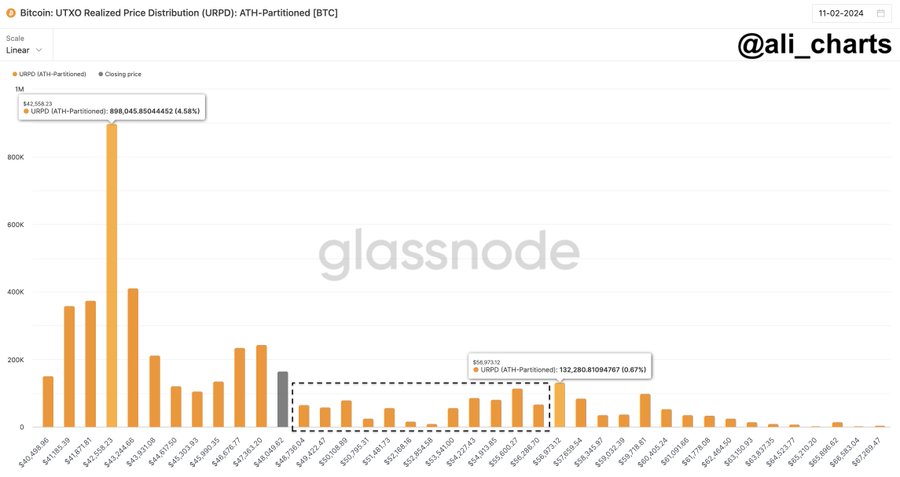
“While a brief price correction is possible, it’s crucial to recognize that the next significant resistance level for BTC is positioned much higher, around $57,000.”

Bitcoin UTXO realized price distribution (URPD). Source: Ali Martinez
Indeed, to drive his point home, Martinez used Bitcoin’s realized price distribution (URPD) of unspent transactions output (UTXO), or the amount remaining after every transaction, suggesting BTC was facing strong resistance at $57,000, or specifically $56,973.12.
Bitcoin price analysis
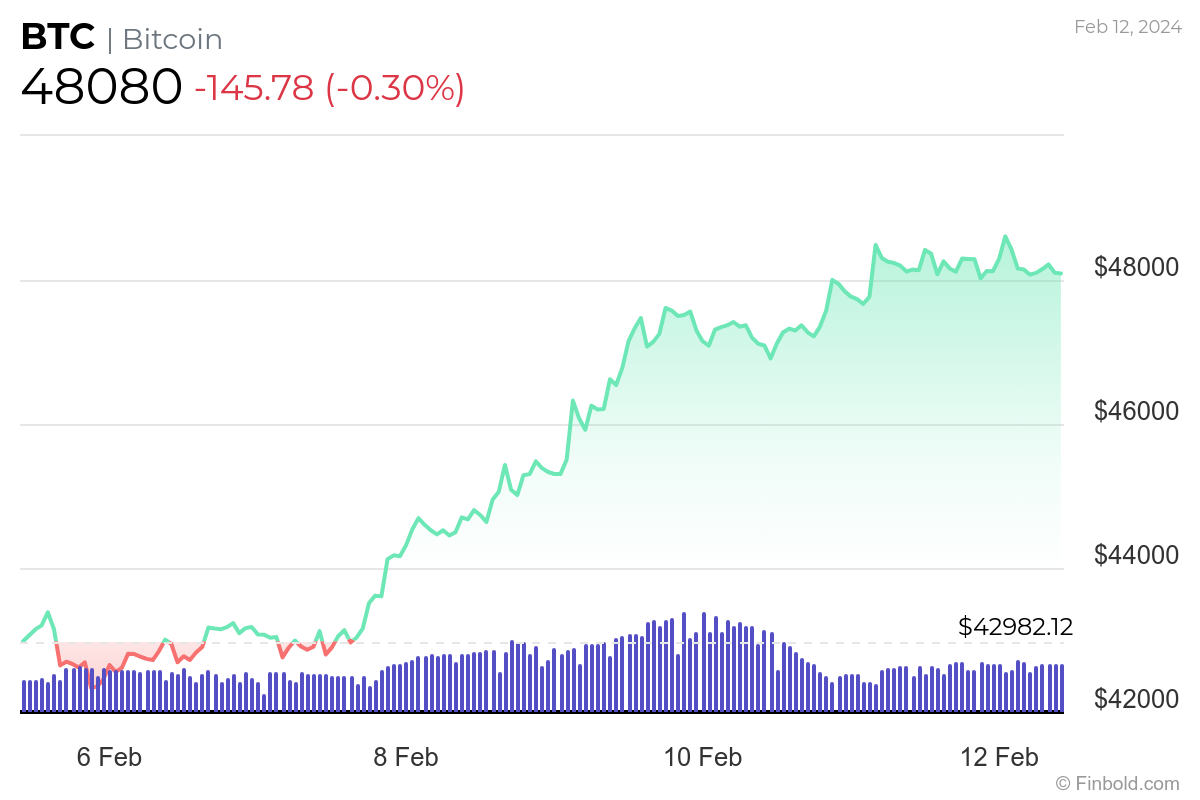
Meanwhile, Bitcoin is at press time changing hands at the price of $48,080, recording a slight daily decline of 0.30%, but nonetheless making a solid gain of 11.83% on its weekly chart and accumulating an increase of 11.31% in the previous 30 days, as per recent data on February 12.

Bitcoin 7-day price chart. Source: Finbold
It is also worth noting that Hunter Horsley, the CEO of the crypto index fund manager Bitwise Invest, suggested that 2024 would unveil the true valuation of Bitcoin in the capital markets in light of the approved spot exchange-traded funds (ETFs) and the upcoming halving.
“Forget what you knew about Bitcoin’s price. In 2024, we’re going to discover how the full capital market actually values Bitcoin,” he said.
In response to Horsley’s statement, David Lawant, the head of research at digital assets prime brokerage firm Falcon X, agreed and noted that the Bitcoin market structure had already started to change for the better, as Finbold reported on February 11.
Disclaimer: The content on this site should not be considered investment advice. Investing is speculative. When investing, your capital is at risk.


