As Bitcoin exchange-traded funds (ETFs) inflows pushed the Bitcoin (BTC) price above the $50,000 mark and Bitcoin halving on the horizon, there are indications that another price correction may be imminent.
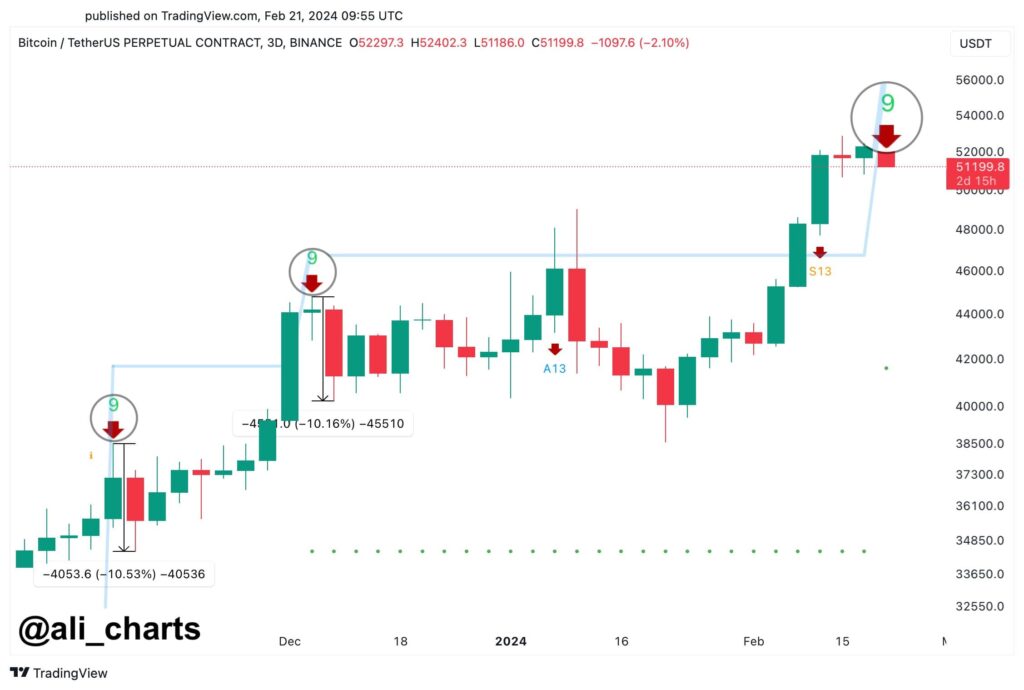
As the TD Sequential indicator suggested, this potential correction could be significant, with a projected reduction of around -10% for the leading cryptocurrency.
Specifically, the TD Sequential indicator has recently signaled a sell on the 3-day chart for Bitcoin. It’s worth noting that when this indicator signaled bearish conditions in previous instances, BTC experienced a price correction of approximately -10%, as highlighted in a post on X by cryptocurrency analyst Ali Martinez on February 21.

Bitcoin’s price chart with TD sequential indicator. Source: Ali Martinez
This would mean a considerable reduction in maiden crypto’s market cap, which recently surpassed the $1 trillion mark.
Implications from a slump in Bitcoin price and possible cause
Given its prominent position in the cryptocurrency market and its interdependency with various altcoins, a potential -10% correction in Bitcoin’s price could result in substantial reductions.
Specifically, this correction would decrease BTC’s market capitalization by approximately $138 billion. Consequently, the total market capitalization would shrink to $865 billion, with Bitcoin’s price correcting to around $45,000.
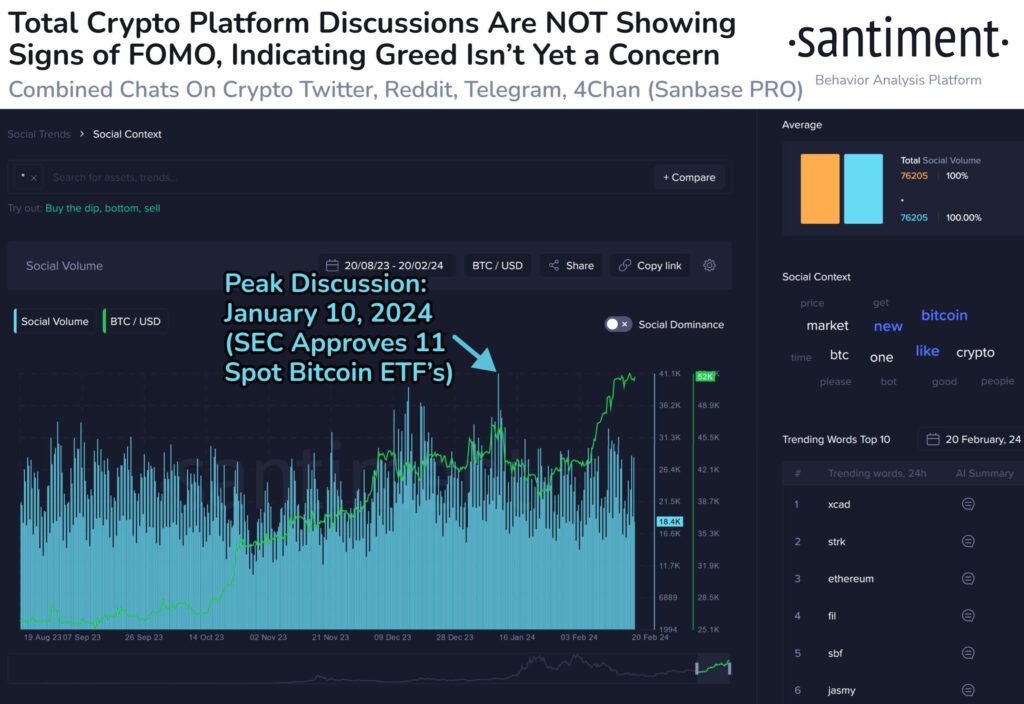
This potential slump in price can explained by that despite Bitcoin’s remarkable price increase of 74% over the past four months, the typical crowd fear of missing out (FOMO) often associated with such surges has been notably absent.
While there was undoubtedly heightened interest in BTC in the weeks preceding and following the SEC’s approval of 11 ETFs, the absence of new greed within the space can be interpreted as expecting a further price increase.

Metric of interactions on social networks regarding BTC. Source: Santiment
Bitcoin price chart
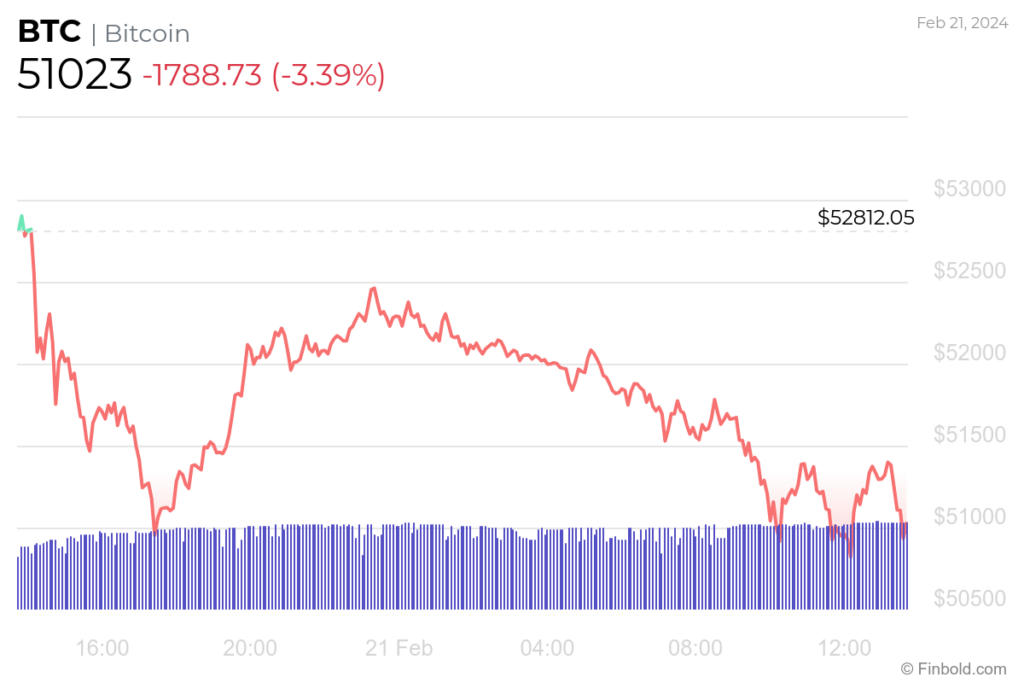
At the time of press, Bitcoin price today is trading at $51,023, reflecting a decline of -3.39% over the past 24 hours. This adds to the losses sustained throughout the week, totaling -1.26%. These recent declines contrast with the impressive gains of 25.02% achieved over the past month.

BTC 24-hour price chart. Source: Finbold
Despite recent outflows and price reductions, technical indicators are unfazed, granting the flagship cryptocurrency a ‘buy’ rating based on 13 evaluations. Moving averages are even more optimistic, signaling a ‘strong buy’ rating in 12 instances. Meanwhile, oscillators indicate a ‘neutral’ rating in 8 cases.

Technical indicators for BTC. Source: TradingView
Only time will reveal whether TD Sequential’s sell sign proves accurate again or if Bitcoin defies this technical indicator and soars to new highs.
Disclaimer: The content on this site should not be considered investment advice. Investing is speculative. When investing, your capital is at risk.


