After hitting an all-time high, Bitcoin (BTC) has experienced volatility, and the market anticipates the next price action at a time when several catalysts, including the upcoming halving, support the maiden cryptocurrency.
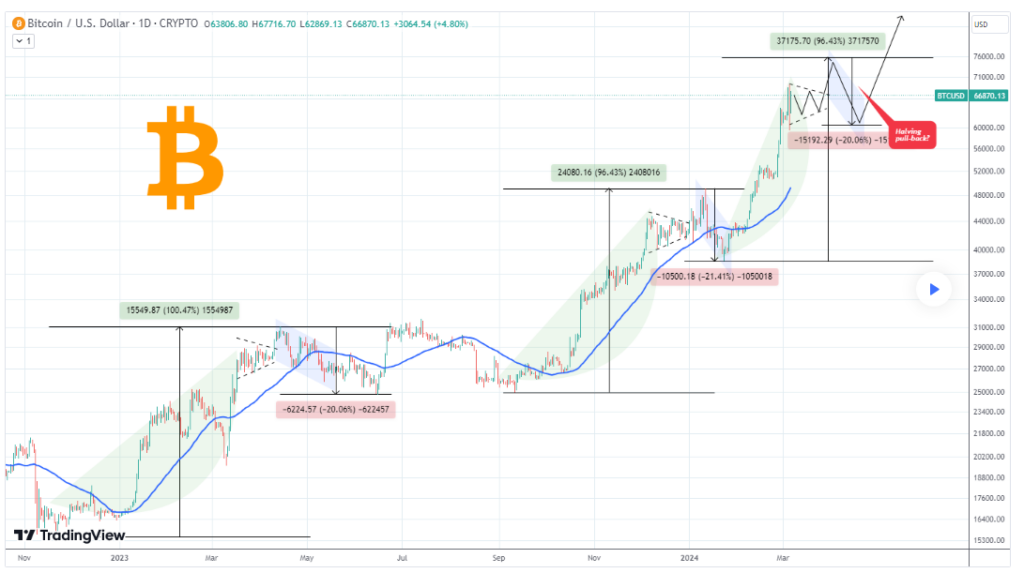
In assessing Bitcoin’s next price target, crypto trading expert Trading Shot established potential price targets in a TradingView post on March 7 based on the asset’s historical patterns observed since the bottom of November 2022.
According to the expert, Bitcoin has exhibited a consistent pattern since the bottom, characterized by a substantial approximately 100% surge, followed by a triangle formation that foreshadows the rally’s peak. Subsequently, there is a notable 20% decline, typically taking the form of a channel down.

Bitcoin price analysis chart. Source: TradingView
“The latest high volatility of the past 3 days resembles those Triangle patterns before the peak. A +96.43% rise, similar to the previous Wave, gets completed around $75500. If BTC continues to replicate those patterns, then a -20% correction should coincide with April’s Halving,” he said.
What next for Bitcoin after ATH?
It’s worth noting that Bitcoin’s recent journey to a new all-time high was sparked by several key milestones impacting the general cryptocurrency landscape. Notably, a series of spot Bitcoin exchange-traded funds (ETFs) that began trading in January are critical catalysts for Bitcoin’s current rally. At the same time, the upcoming halving event has heightened expectations.
Bitcoin halvings, occurring every four years, reduce mining rewards by half, slowing new Bitcoin creation. Historically, they have influenced Bitcoin prices, attributed to scarcity by analysts and fueled previous price rallies.
Overall, the timing of the record high is significant, considering that the asset typically achieves a new peak after the halving. This could indicate that the market is experiencing an earlier, sharper, shorter bull cycle that might follow a correction.
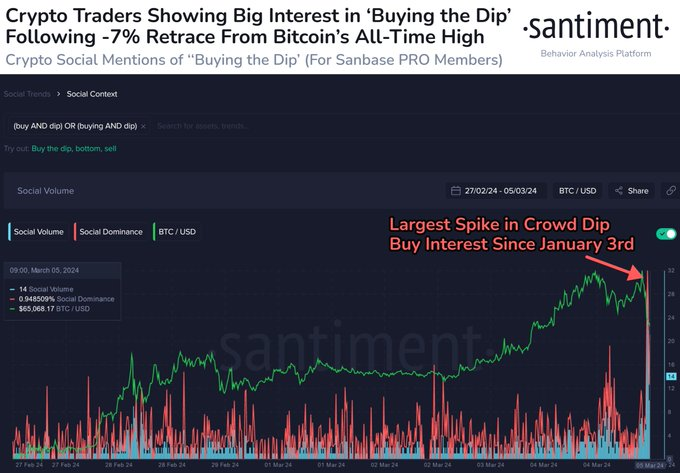
However, the market has expressed concerns with Bitcoin correcting by almost 10% after reaching an all-time high. Notably, on March 5, crypto on-chain data analysis platform Santiment pointed out that buy-in-the-dip calls reached their highest level in a couple of months following the drop.

BTC buy in the dip interest. Source: Santiment
Bitcoin price analysis
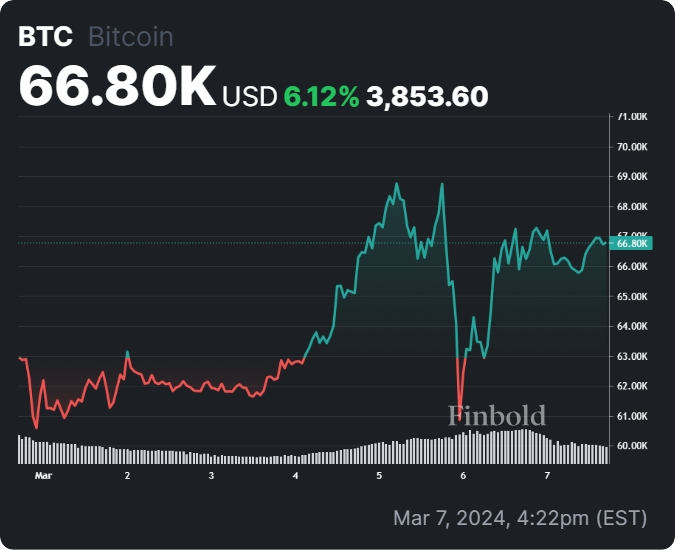
By press time, Bitcoin was valued at $66,804, with daily gains of 1.3%. Over the past seven days, BTC has increased about 6%.

BTC seven-day price chart. Source: Finbold
Overall, Bitcoin’s next trajectory remains uncertain, considering that the asset is susceptible to factors such as increased profit-taking that could result in losses.
Disclaimer:The content on this site should not be considered investment advice. Investing is speculative. When investing, your capital is at risk.


