Bitcoin (BTC) is currently hovering and consolidating above the $70,000 mark, partly buoyed by a slowdown in outflows from spot exchange-traded funds (ETFs). With the cryptocurrency having recently shattered two record highs within days, all eyes are on its potential for yet another historic milestone.
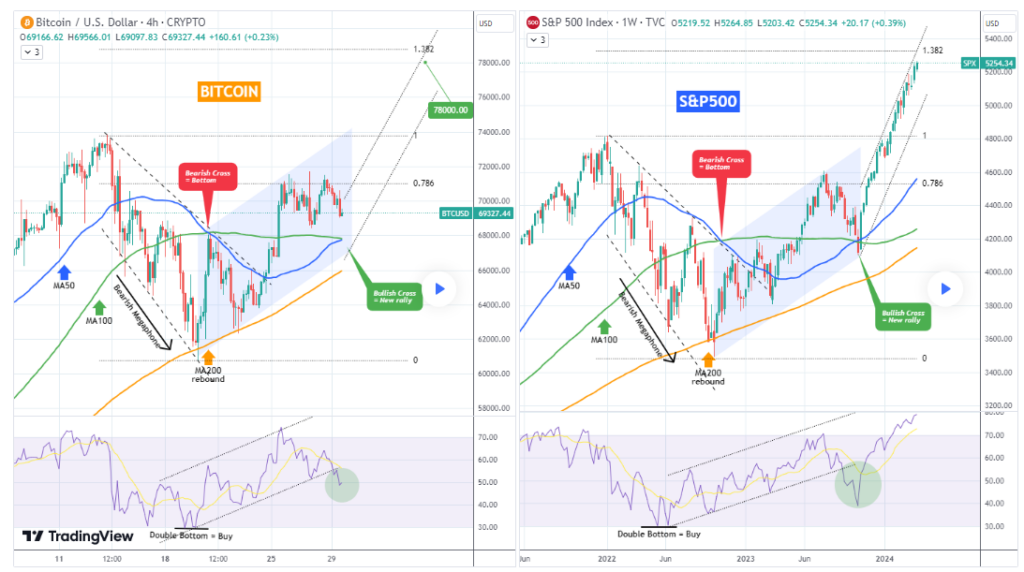
In this regard, TradingShot, a crypto trading expert, shared insights in a TradingView post on March 30. According to the analysis, Bitcoin’s technical indicators strongly point to a bullish immediate price target that could pave the way for a new record high of $78,000.

Bitcoin price analysis chart. Source: TradingView
The analyst pointed out that Bitcoin is mirroring a fractal pattern observed in the S&P 500 index, albeit in different time frames. While Bitcoin operates on a four-hour time frame, the S&P 500 analysis is on a weekly time frame.

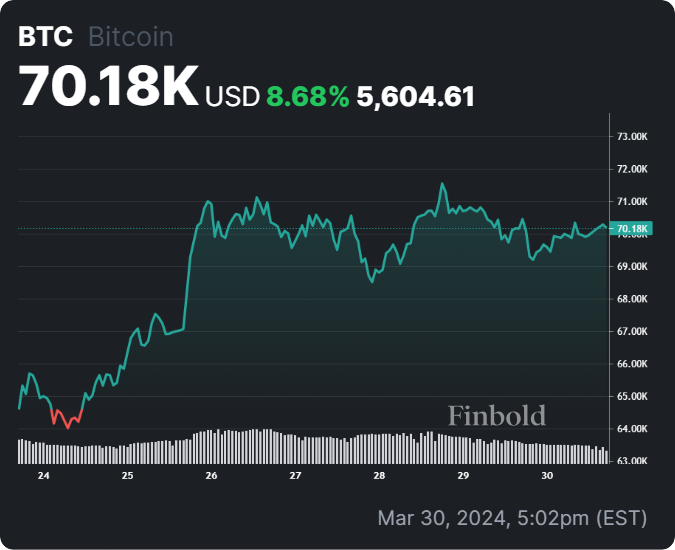
Bitcoin seven-day price chart. Source: Finbold
In addition to the factors surrounding the upcoming halving and ETF flows, the current price of Bitcoin remains susceptible to decisions made by the Federal Reserve regarding interest rates.
Disclaimer:The content on this site should not be considered investment advice. Investing is speculative. When investing, your capital is at risk.


