Although Bitcoin (BTC) has started to slow down the bullish momentum from the past weeks, a renowned cryptocurrency analyst is exceptionally optimistic regarding its price in the coming months and years, potentially even reaching the level of $1,000,000.
As it happens, pseudonymous crypto trading expert PlanB has shared a detailed analysis and Bitcoin price prediction for 2024 and 2025, observing the previous and recent movements of the flagship decentralized finance (DeFi) asset on multiple charts analyzed in a video streamed on April 1.
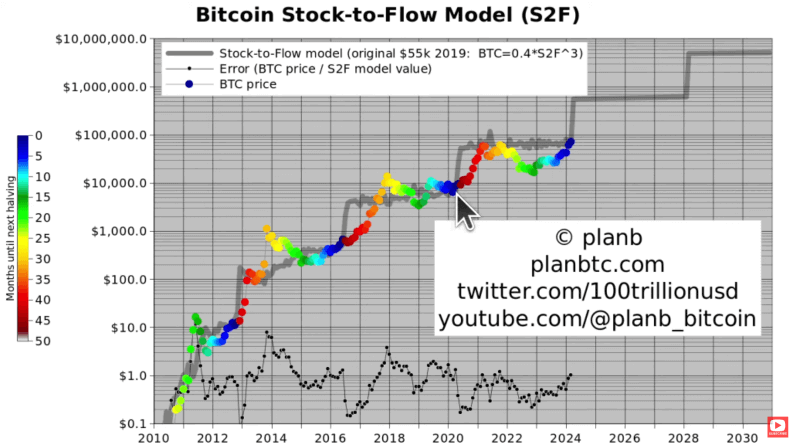
Specifically, the analyst pointed out on the Bitcoin stock-to-flow chart that the maiden crypto asset had a new all-time high (ATH) before the halving for the first time ever, adding that the “Bitcoin value is roughly at the stock-to-flow model line (…) and that’s always the case (…) just before the halving and this time also, like clockwork.”

Bitcoin stock-to-flow chart. Source: PlanB
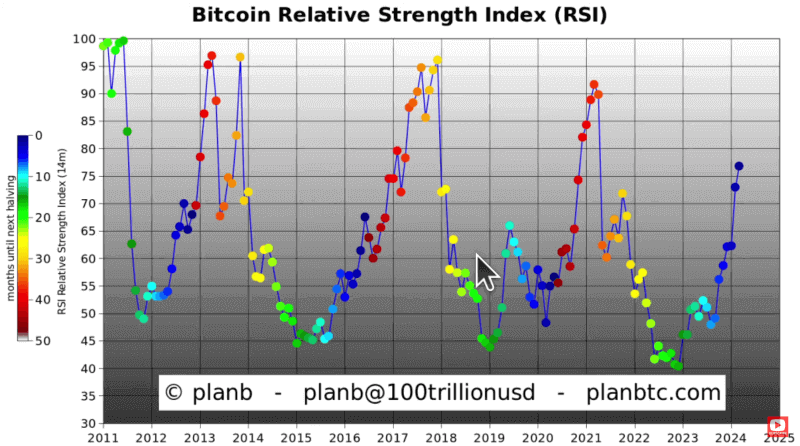
Additionally, the expert shared a Bitcoin relative strength index (RSI) chart, noting that it is at 77, the “highest level ever before a halving, and that’s interesting because what we’ve seen so far is that (…) the RSI just before the halving was getting lower, (…) and that’s in line with diminishing returns.”
“So the fact that we’re not at 77, which is the highest level ever, could mean that this is the first indication that the diminishing returns will not be there and we will stay in an exponential return growth path (…) which would be in line with the stock-to-flow model.”

Bitcoin RSI chart. Source: PlanB
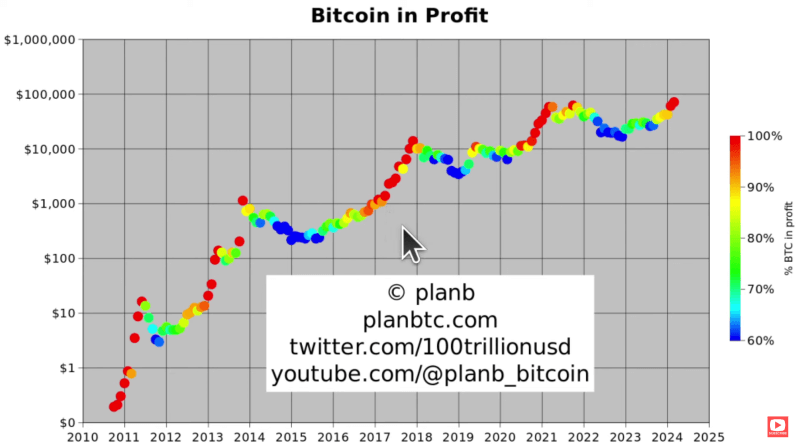
Finally, the crypto market expert concluded his analysis with a Bitcoin in profit chart, which suggests more advances in the future, arguing that “if we look at Bitcoin in profit, that’s 100% at ATH levels, everybody’s in profit and that will continue for a couple of months if history is any guide.”

Bitcoin in profit chart. Source: PlanB
Bitcoin price analysis
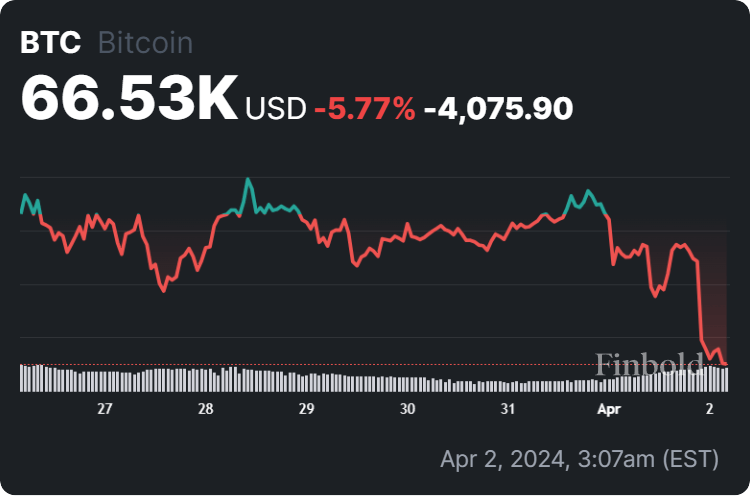
For now, Bitcoin is changing hands at $66,530, suggesting a decline of 4.31% in the last 24 hours, as well as a 5.77% drop on its weekly chart but is still holding onto the monthly gain of 7.91%, according to the most recent data retrieved by Finbold on April 2.

Bitcoin price 7-day chart. Source: Finbold
All things considered, multiple historical indicators are all lining up for Bitcoin to skyrocket in the next few months and years, particularly considering the role of its halving. However, doing one’s own research is critical before investing, as the situation in this field can make an unexpected twist.
Disclaimer: The content on this site should not be considered investment advice. Investing is speculative. When investing, your capital is at risk.
Watch the entire video below:


