Bitcoin (BTC) is back trading in the $69,000 price range, slightly below the psychological level of $70,000. On a volatile day, cryptocurrency traders look for insights on relevant support and resistance levels for the week.
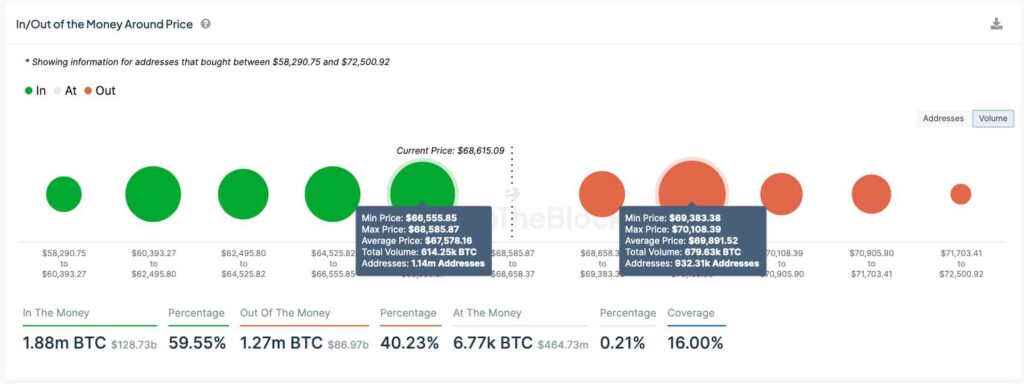
One way of spotting these key levels is by using on-chain data to identify price ranges with potential buying or selling pressure. In particular, IntoTheBlock provides data on the Bitcoin volume that is “in or out of the money,” on April 10.
For example, the 614,250 BTC kept by 1.14 million addresses can form support between $66,555 and $68,585, averaging $67,578 per Bitcoin. This is because investors who previously purchased at these prices are currently profitable and likely to repeat the strategy.

In/Out of the Money Around Price. Source: IntoTheBlock
BTC support and resistance price analysis
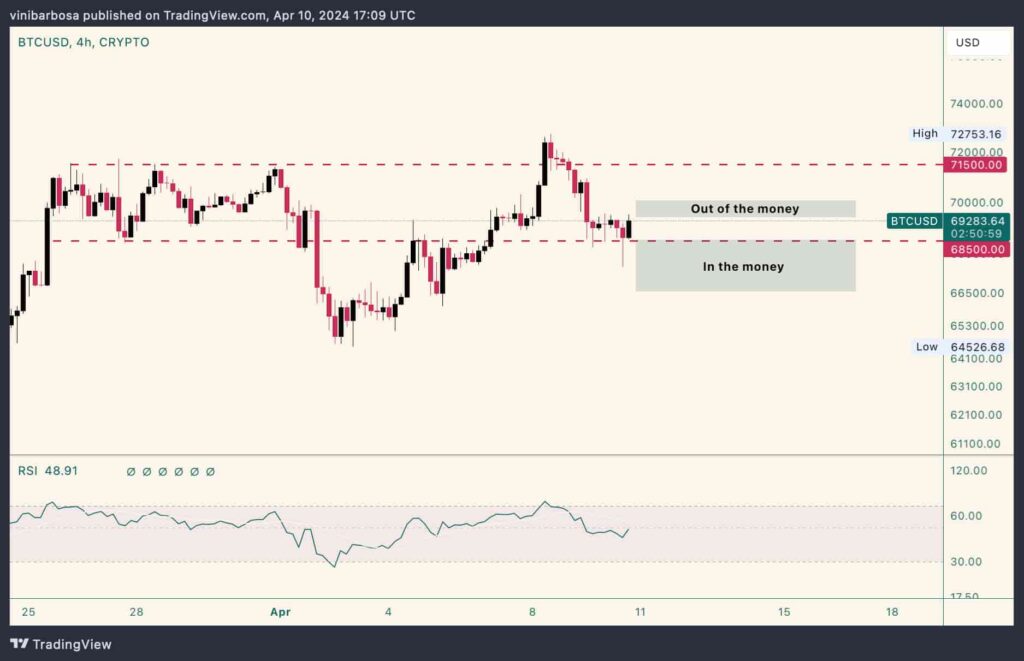
Interestingly, the on-chain support zone is aligned with technical analysis support at $68,500, at the bottom of a trading range. During today’s dip, Bitcoin briefly lost its range, just to quickly retrace inside of it again.
As a result, BTC tested and validated the aforementioned expected buying pressure within the “in the money” volume. Particularly trading as low as $67,500, on the averaging price support we previously observed.

BTC/USD 4-hour price chart. Source: TradingView (Finbold)
Now, investors must watch for both levels, as they could tighten Bitcoin’s trading range, or provide valuable buy and sell signals in case BTC breaks any of them. Potentially moving to the following supports and resistances. As of writing, Bitcoin trades at $69,283 and a breakout to the upside could test the range’s top at $71,500.
Disclaimer: The content on this site should not be considered investment advice. Investing is speculative. When investing, your capital is at risk.


