Bitcoin (BTC) has once again surpassed the $70,000 mark, rebounding from volatility triggered by higher-than-expected inflation data in the United States.
Despite trading above this psychological threshold, the maiden cryptocurrency has predominantly consolidated below its previous all-time high, leaving the market on edge regarding its next direction.
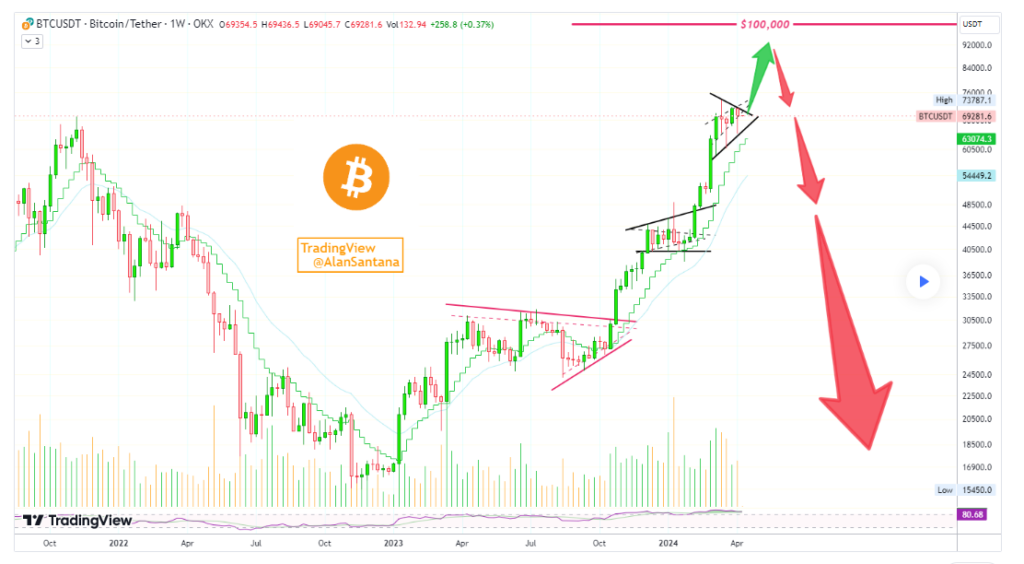
In examining the potential price movements, crypto trading expert Alan Santana pointed out that recent movements show that Bitcoin is in a stalemate as it struggles to break through resistance, with a strong bearish signal potentially on the horizon.

Bitcoin price analysis chart. Source: TradingView
However, Santana noted that challenging resistance can weaken it over time. Should Bitcoin fail to surpass the $70,000 mark and instead dip, it could signal a strongly bearish trend.
“The interesting and revealing part is that $70,000 is less than ten percent away from the all-time high. This tells us that Bitcoin is actually challenging resistance at this point. The more resistance level is challenged, the weaker it becomes. Say prices move below $70,000 to hit $68,000 or $65,000; strongly bearish but again, as it moves above 70K we need to consider the other scenarios and adapt just as the market does,” the analyst said.
Bitcoin suffers volatility ahead of halving
Elsewhere, following the release of inflation data, Bitcoin experienced a drop to approximately $68,000. However, the prevailing sentiment in the market remains optimistic, buoyed by underlying bullish factors such as the upcoming halving event.
Additionally, the potential approval of a spot Bitcoin exchange-traded fund (ETF) in Hong Kong is seen as a significant development that could influence the asset’s short-term trajectory.
Moreover, some analysts interpret the current Bitcoin price as indicative of a potential breakout, with the $100,000 milestone representing the primary target for the next all-time high.
Bitcoin price analysis
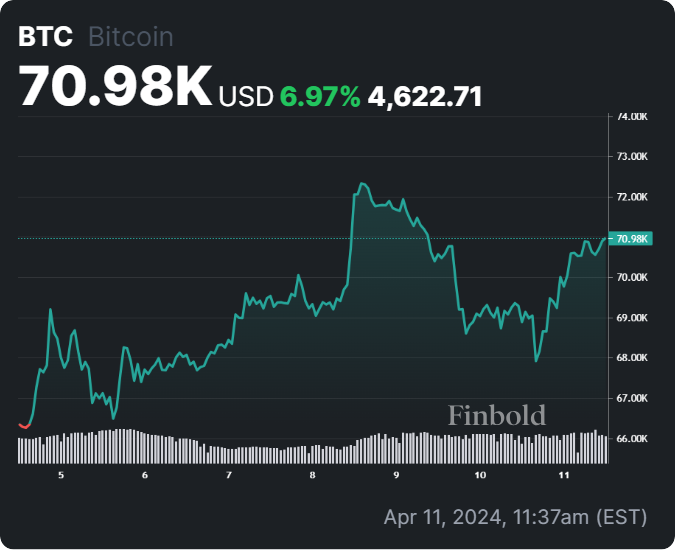
By press time, Bitcoin price today was trading at $70,977, reflecting a notable rally of over 3% in the past 24 hours. On the weekly chart, BTC has seen a rise of nearly 7%.

Bitcoin seven-day price chart. Source: Finbold
In the meantime, investors are closely monitoring Bitcoin’s movement, particularly its ability to surpass the $71,000 level. Sustaining the price above this threshold could signal bullish momentum in the market.
Disclaimer: The content on this site should not be considered investment advice. Investing is speculative. When investing, your capital is at risk.


