Following the completion of the 2024 Bitcoin (BTC) halving, the focus has turned to the asset’s price trajectory, which has exhibited volatility in the short term.
Before the halving event, Bitcoin aimed to maintain stability above the $65,000 mark. However, the leading cryptocurrency has faltered in retaining this position, with its price now facing the looming threat of dipping below.
Amidst uncertainty, several crypto analysts have offered insights into what to anticipate regarding Bitcoin’s valuation post-halving.

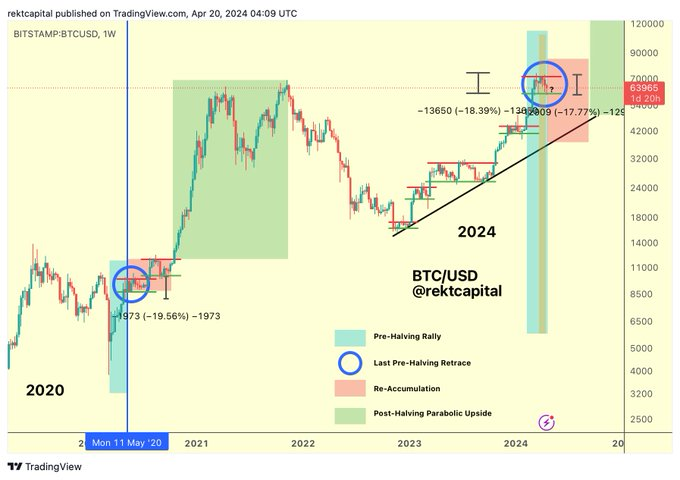
Bitcoin price analysis chart. Source: TradingView/Rekt Capital
“When the Pre-Halving Retrace bottoms, that bottom acts as the base of the Re-Accumulation (i.e. Range Low). When this Range Low is established, a bout of consolidation begins in preparation for a future breakout into Parabolic Upside,” the analyst said.
Bitcoin’s price bottom
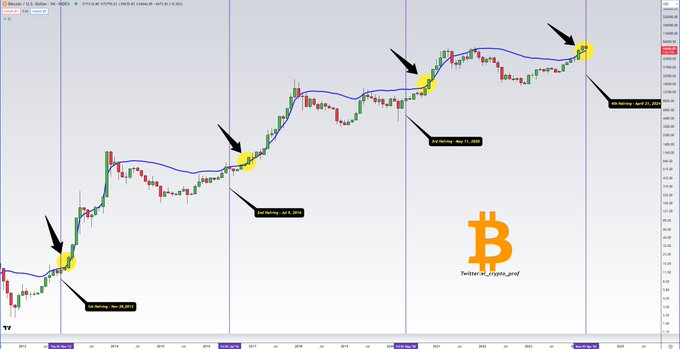
Adding to the optimism is an analyst with the pseudonym El_crypto_prof, who indicated that Bitcoin may have found its bottom, suggesting a potential turnaround in its price trajectory.
Notably, the expert highlighted the significance of reclaiming certain technical levels before the halving, a pattern observed in previous market cycles that has often preceded significant upward movements.

Bitcoin price analysis chart. Source: TradingView/El_crypto_prof
Overall, Bitcoin continues to endure bearish sentiments, with various market indicators indicating sustained losses for the cryptocurrency. For instance, according to a report by Finbold, Bitcoin’s average transaction fees surpassed the $100 mark for the first time on April 20, post-halving, suggesting a potential sell-off.
Uncertainty is further heightened, considering Bitcoin reached its record high before the halving event, diverging from historical trends. Consequently, it remains challenging to determine if Bitcoin will experience further upward momentum, though the potential for increased volatility persists.
Bitcoin price analysis
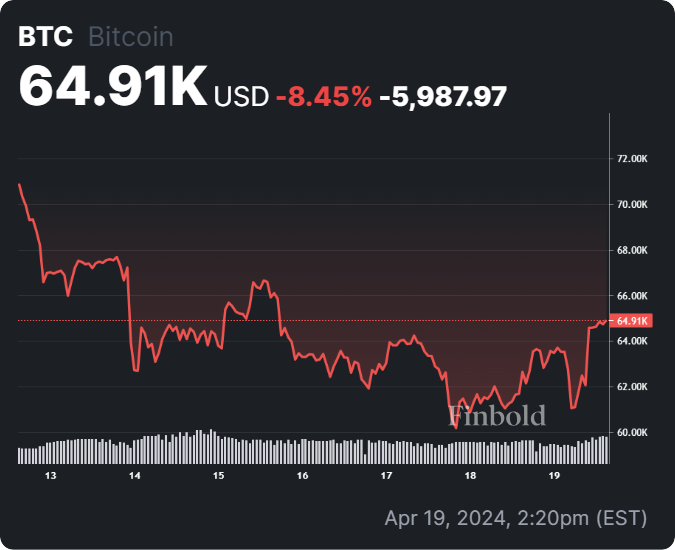
By press time, Bitcoin had retraced after briefly touching the $64,000 level. It is currently trading at $63,865, marking a plunge of over 5% in the past seven days.

Bitcoin seven-day price chart. Source: Finbold
At the same time, Bitcoin’s one-day technical analysis, sourced from TradingView on April 20, indicates bearish sentiments. A summary of indicators, moving averages, and oscillators align with a sell sentiment, registering at 11 and 2, respectively.

Bitcoin technical analysis. Source: TradingView
While these analyses provide insight into potential future movements, unforeseen events such as escalating geopolitical tensions can quickly alter price trajectories.
Disclaimer:The content on this site should not be considered investment advice. Investing is speculative. When investing, your capital is at risk.


