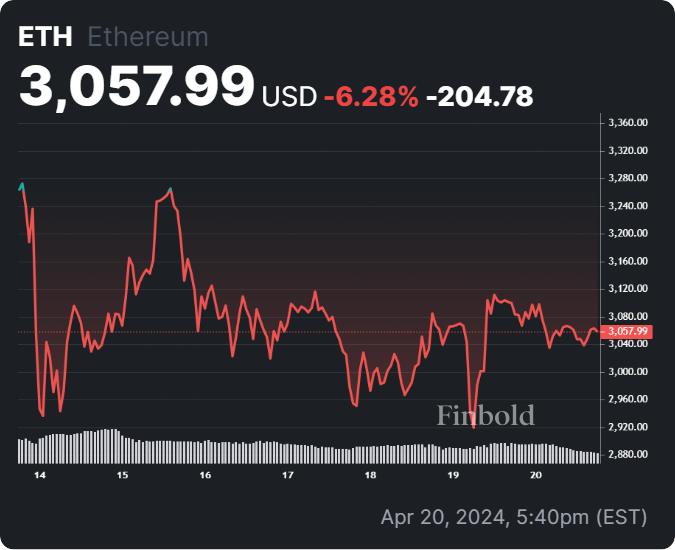
Ethereum (ETH) has recently experienced notable volatility amid market price fluctuations. Despite this uncertain environment, Ethereum aims to maintain its price above the crucial $3,000 support zone.
Part of the volatility can be attributed to increased whale activity involving ETH, as significant amounts of the token are being transferred to exchanges. For instance, Whale Alert data on April 20 indicated that 10,911 ETH, valued at approximately $33.52 million, was transferred to Coinbase.
Such large movements to major exchanges like Coinbase raise concerns about sustained volatility in Ethereum’s price, especially considering the decentralized finance (DeFi) asset’s susceptibility to overall market bearish sentiments.

ETH seven-day price chart. Source: Finbold
Ethereum price AI prediction
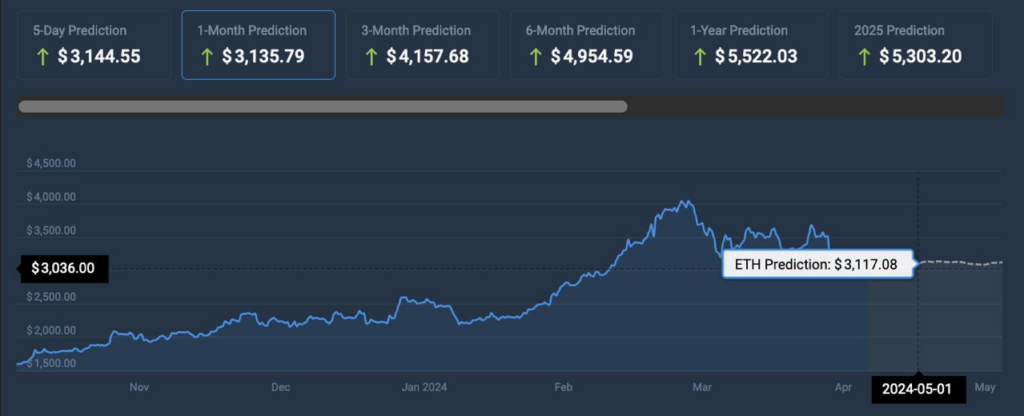
Ethereum is teetering just above the $3,000 zone, a critical juncture, as losing this level could trigger a further downward trajectory. Seeking insights into Ethereum’s potential future movements, Finbold turned to predictions from artificial intelligence (AI) machine algorithm models at CoinCodex.
According to data retrieved on April 20, Ethereum is projected to trade at $3,117.08 on May 1, representing an increase of approximately 1.7% from its current valuation.

ETH prediction, May 1, 2024. Source: CoinCodex
It’s worth noting that May has significant regulatory implications for Ethereum. The Securities and Exchange Commission (SEC) is likely to decide on approving a spot Ethereum exchange-traded fund (ETF).
Should this product receive approval, its potential impact on Ethereum’s market dynamics remains uncertain. It will be crucial to monitor whether it will echo the precedent set by similar ETFs for Bitcoin (BTC).
ETH’s key support zone to watch
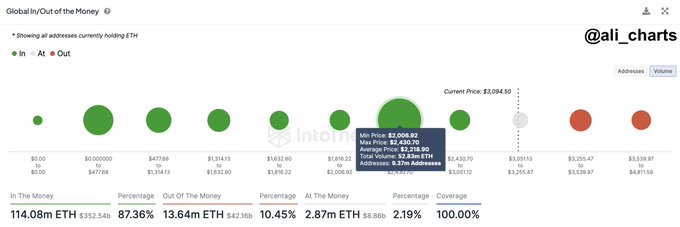
Amid ongoing uncertainty surrounding Ethereum’s price, crypto analyst Ali Martinez cautioned on April 16 that should ETH continue a downward trend, investors should closely monitor the critical support zone between $2,000 and $2,430.
Within this range, approximately 9.37 million addresses hold nearly 53 million ETH. A breach of this support zone could potentially intensify selling pressure and exacerbate the downturn.

ETH money in/out chart. Source: IntoTheBlock/ali_charts
Furthermore, Ethereum’s technical indicators remain predominantly bearish. A summary of the one-day gauges retrieved from TradingView indicates a ‘sell’ sentiment at 13, with similar sentiments reflected in moving averages and oscillators at 10 and 3, respectively.

Ethereum technical analysis. Source: TradingView
In conclusion, despite prevailing bearish sentiments surrounding Ethereum, the asset stands to benefit from any bullish resurgence in the broader market, likely driven by the aftermath of the Bitcoin halving event.
Disclaimer:The content on this site should not be considered investment advice. Investing is speculative. When investing, your capital is at risk.


