Shiba Inu (SHIB) is back to a 2-month consolidation range after briefly losing it as geopolitical tensions brought uncertainties. Now, Finbold has identified key support and resistance levels to watch this week in SHIB’s on-chain data and price chart.
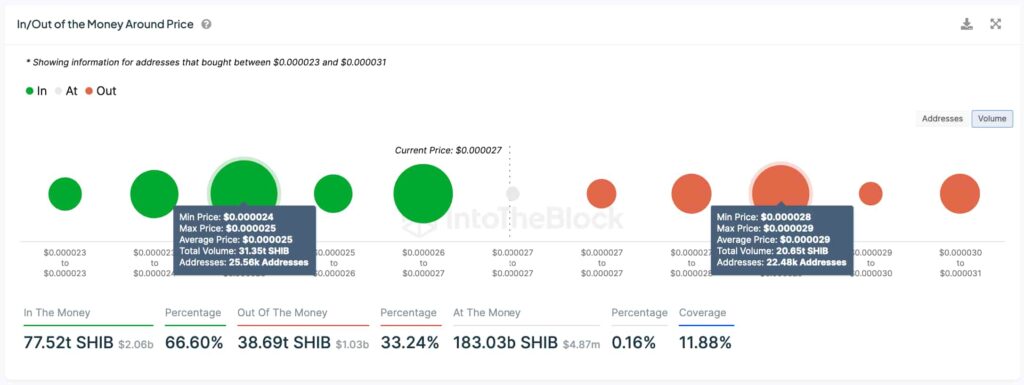
Over two-thirds of Shiba Inu‘s supply is in profit, with 77.52 trillion SHIB purchasing the token at lower prices. With that in mind, high-volume purchasing prices can give insights into key levels that will likely see increased trading activity.
In particular, on-chain data from IntoTheBlock show the “in/out of the money around price,” separated by addresses and volume. By press time, Shiba Inu had traded at nearly $0.000027.

SHIB In/Out of the Money Around Price, by volume. Source: IntoTheBlock
Shiba Inu (SHIB) price: Technical support and resistance
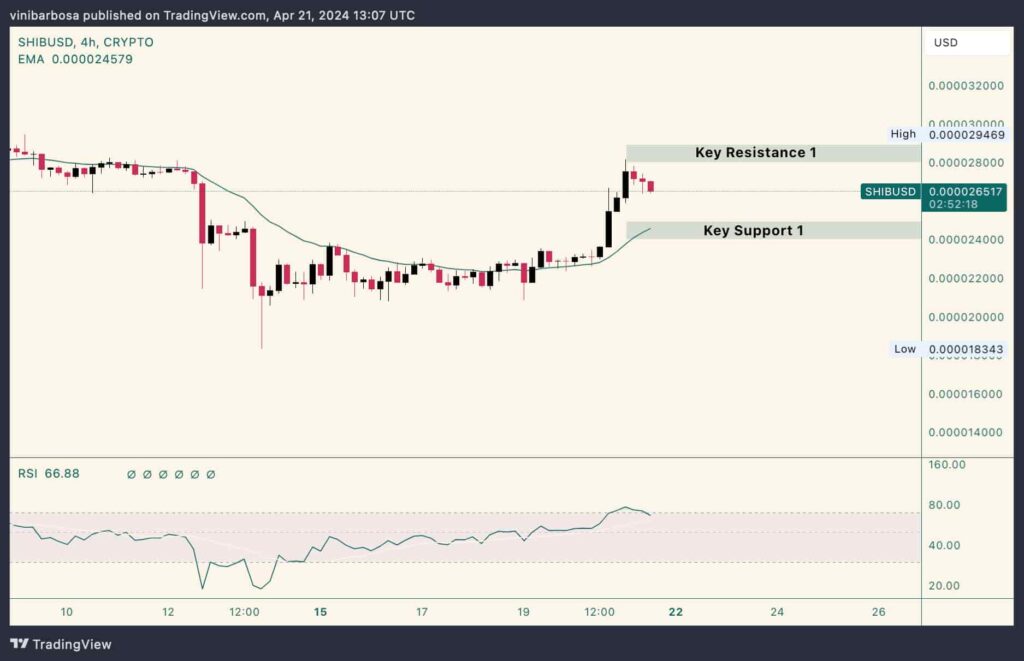
In the meantime, the 4-hour price chart illustrates similar key support and resistance levels. On that note, the 20EMA (20-period exponential moving average) traces support at $0.0000245, while the previous price action marks a resistance below $0.000029.
This time frame’s Relative Strength Index (RSI) indicates a bullish strong momentum for SHIB with 66.88 points, suggesting the meme coin could soon test its key resistance and, perhaps, the $0.000030 psychological level.
Nevertheless, Shiba Inu recently traded as low as $0.000018, raising alerts to the $0.000020 psychological support.

SHIB/USD 4-hour price chart. Source: TradingView/Finbold
The Shiba Inu-inspired token earned traders’ and investors’ attention in the previous bull cycle. However, the market has turned to new Solana (SOL) meme coins in 2024, which slowed down the demand for SHIB.
With that in mind, investors must be cautious while allocating meaningful capital to a token that could have lost its long-term momentum despite the short-term favorable outlook.
Disclaimer: The content on this site should not be considered investment advice. Investing is speculative. When investing, your capital is at risk.


