Bitcoin (BTC) is navigating the post-halving phase, facing resistance below the last all-time high. As the crypto continues to find its footing, a section of the market believes that Bitcoin is in line to embark on a post-halving rally, an element backed by several analysts.
For instance, crypto trading expert TradingShot acknowledged in a TradingView post on April 22 that Bitcoin is at a critical juncture, struggling to surpass and sustainably close above its record-high resistance.
According to the analyst, the pattern has been marked by a period of sideways consolidation, and while it might suggest bearish sentiments, history suggests otherwise.
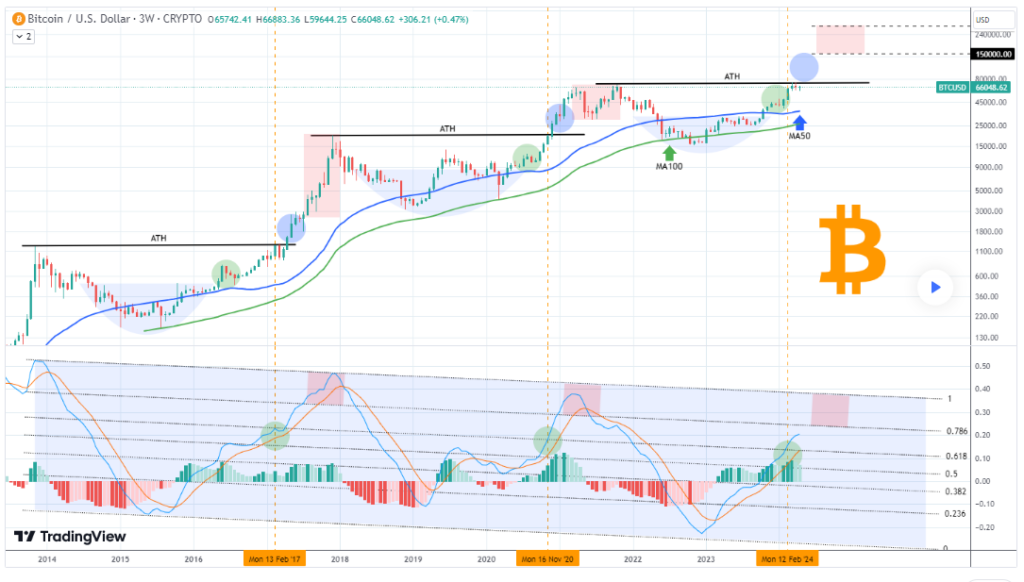
Bitcoin price analysis chart. Source: TradingView/TradingShot
“On any other occasion, that would be a bearish signal, an inability of the market to find enough willing buyers to push it to a new High. But with BTC’s historic cycles this has proved to be just a stepping stone before the most aggressive phase, the non-stop rally that drives the Cycle to its peak. (…) We estimate this to take place within the (admittedly) wide range of $150,000 – $300,000, depending on market conditions and relevant global demand from ETFs,” the expert said.
Indicators to watch
Based on the analysis, the key indicator signaling the potential rally is the three-week Linear Moving Average Convergence Divergence (LMACD).
The expert noted that the indicator, trading within a channel-down pattern from the outset, tends to reach a critical juncture when it hits the 0.618 Fibonacci channel level. At this point, Bitcoin has historically closed above its record high and embarked on a robust rally.
Furthermore, the analysis suggested that the formation of a peak characterizes the final phase of this cycle. This occurs as the LMACD approaches the channel’s upper boundary and reverses, often preceding a bearish cross.
Bitcoin price analysis
By press time, Bitcoin was trading at $66,283 with daily gains of almost 0.4%. On the weekly chart, BTC is up 5%.
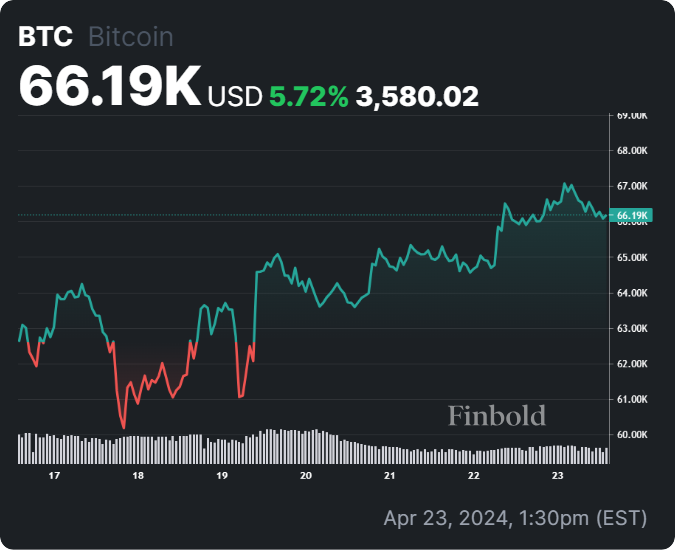
Bitcoin seven-day price chart. Source: Finbold
Overall, the current Bitcoin price movement shows the cryptocurrency’s resilience after shrugging off the fallout from geopolitical tensions. Indeed, Bitcoin is establishing itself above the $65,000 mark amid a possible cooling down of tensions in the Middle East.
The $65,000 mark remains pivotal for market participants, as it will play a key role if the analyst’s projections are to be realized.
Disclaimer: The content on this site should not be considered investment advice. Investing is speculative. When investing, your capital is at risk.