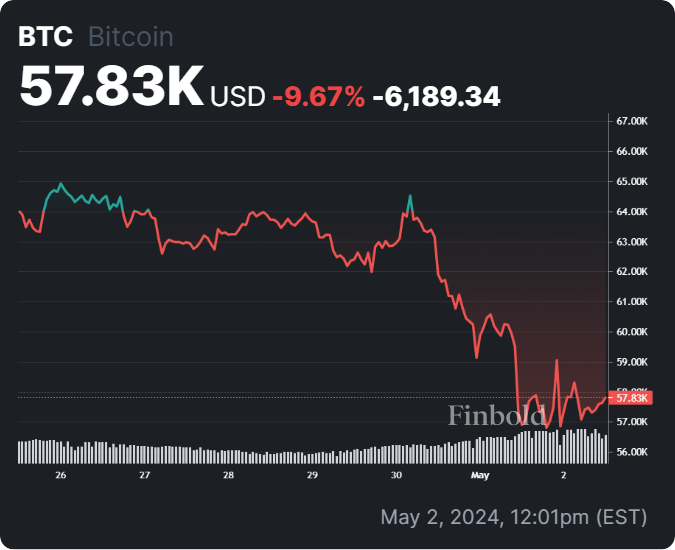
Bitcoin (BTC) began May with a significant sell-off after losing crucial support at $60,000 and falling as low as $56,000 leaving many market participants anticipating further declines.
This plunge comes as the crypto market remains on the edge, with uncertainty lingering about the potential onset of the historical post-halving rally.
In light of these developments, crypto analyst Plan B shared insights into Bitcoin’s price outlook for the remainder of the month in a YouTube video posted on May 1.

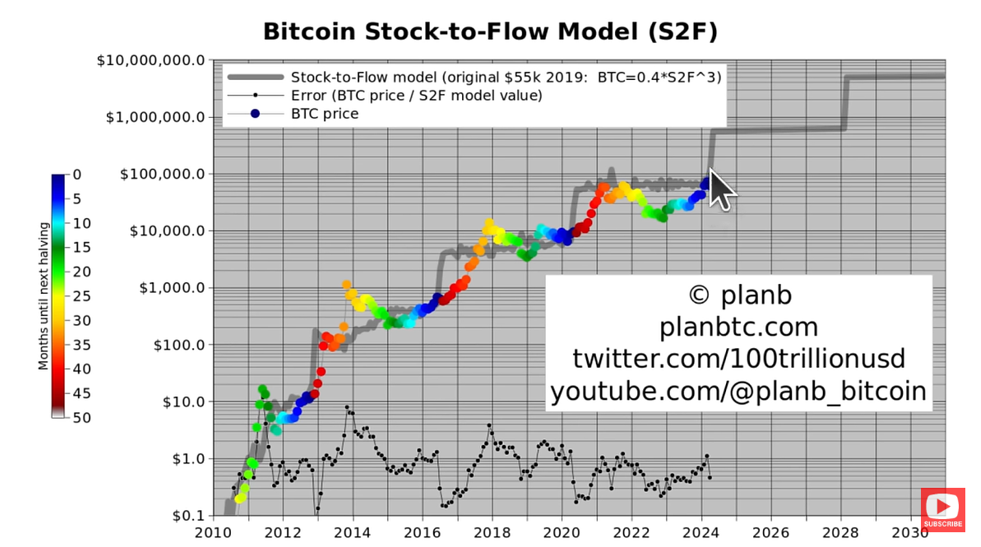
Bitcoin stock-to-flow model. Source: Plan B
Bitcoin price targets
Regarding specific price points, the expert pointed out that while the current average Bitcoin price hovers around $34,000, it closely aligns with the ballpark figure of $55,000 predicted by the original 2019 model.
“The average price is something that we can calculate at the moment. It’s $34,000, and that’s a little below the $55,000 that the 2019 original stock-to-flow model predicted, but it’s in the ballpark. It’s the same order of magnitude, and don’t forget in 2019, the Bitcoin price was below $4,000. The average Bitcoin price was above the stock-to-flow model price in the cycle before the last cycle, the 2016-2020 cycle,” he said.
Despite some fluctuations, Plan B updated the model’s parameters, maintaining an average target price of around $500,000 between 2024 and 2028. He highlighted the importance of the halving event in driving up the model value, anticipating a gradual increase in Bitcoin’s price over the coming months.
Looking ahead to the second half of 2024, the expert expressed confidence in Bitcoin reaching $100,000, driven by the need for mining revenue to recover following the halving event. He based this prediction on historical trends, noting that mining revenue typically recovers within four to eight months post-halving.
The trading expert also expects the market peak to occur in 2025, with Bitcoin’s price potentially surpassing $200,000.
Technical indicators’ prediction
Plan B also analyzed technical indicators such as the Relative Strength Index (RSI) and the 200-week moving average (MA). He noted that the RSI has normalized to around 66 after reaching a high of 77. This normalization suggests that Bitcoin’s price is stabilizing within the context of previous market cycles.
He mentioned that the 200-week moving average has increased slightly to $34,000. The analyst described this value as a conservative floor for Bitcoin’s price during bull markets, indicating that Bitcoin prices typically rise well above this level during such periods.
Notably, Bitcoin’s current losses came after the halving event, while interest in exchange-traded fund (ETF) flows was exhausted. This has left Bitcoin investors focusing on the Federal Reserve’s monetary policy amid stubborn inflationary figures. At the moment, the Fed has left interest rates unchanged.
Bitcoin price analysis
By press time, Bitcoin was trading at $57,779, having registered weekly losses of almost 10%.

Bitcoin seven-day price chart. Source: Finbold
As things stand, Bitcoin must now maintain its price above the $55,000 mark, as a drop below this level could validate sustained bearish sentiment.
Disclaimer:The content on this site should not be considered investment advice. Investing is speculative. When investing, your capital is at risk.


