The price of Bitcoin (BTC) has surged above the $60,000 mark, coinciding with a rise in the stock market amidst a weaker-than-expected US jobs report.
Consequently, there is a consensus that Bitcoin is poised for further gains, and cryptocurrency trading expert TradingShot has identified potential entry points for investors in BTC.
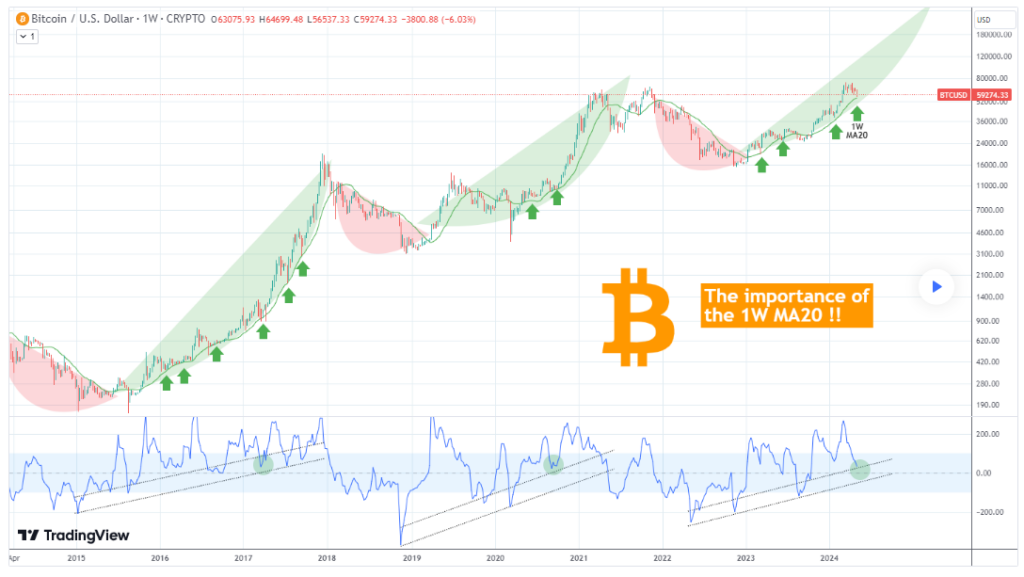
In a TradingView post on May 3, the analyst first suggested that Bitcoin’s recent drop to as low as $56,000 brought it close to a critical support level at around $59,000. This movement signals an ideal moment for investors to buy in before a parabolic rally.

Bitcoin price analysis chart. Source: TradingView/TradingShot
Notably, the expert pointed out the behavior of the one-week commodity channel index (1W CCI), which is currently testing the top of its bull cycle support zone. This behavior resembles previous instances, such as September 07, 2020, and March 20, 2017, which preceded parabolic rallies, making them optimal entry points for buyers.
Importance of one-week moving average
The analyst also focused on Bitcoin’s proximity to the one-week moving average 20 (1W MA20), which is significant for the asset. According to the expert, this level has historically served as consistent support during bull cycles.
At the same time, TradingShot examined past cycles, noting that the 1W MA20 has been breached only three times, none occurring during the 2015-2017 bull run, twice during the 2019-2021 period, and once during the current 2023-2024 run.
This suggests that the 1W MA20 is technically the strongest support level Bitcoin encounters before the ultimate 1W MA50, typically only breached during bear cycles.
Bitcoin cycle top
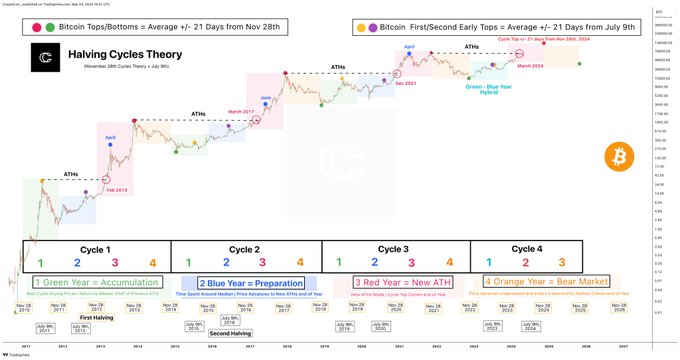
Elsewhere, with Bitcoin recovering, crypto analyst CryptoCon suggested that the maiden digital asset cycle top could be approaching by year-end, echoing patterns seen in 2017. Comparing current market dynamics to 2017, the analyst observed both periods witnessed Bitcoin surpassing all-time highs in March.
However, in 2017, new ATHs emerged by late April or early May, indicating a potentially accelerated trajectory compared to the present.
The market expert indicated that an extended correction around record highs could postpone the cycle top, with projections targeting mid to late 2025.

Bitcoin price analysis chart. Source: TradingView/CryptoCon
“To see our top late 2025 as normal, price would need to not make new ATHs for 7 months, or until after November 28th this year,” the expert said.
Indeed, with most of the market anticipating a Bitcoin rally in the coming months, analysts believe that maintaining gains above $60,000 remains crucial. The asset has rebounded after dropping to as low as $56,000 amid uncertainty surrounding the next Federal Reserve monetary policy.
The latest Bitcoin gains came as the US jobs report revealed a shortfall. Employers added 175,000 jobs last month against expectations of a 243,000 increase. Wages rose by 3.9% in the 12 months through April, below the anticipated 4.0% gain following a 4.1% increase in March.
This disappointment could pressure the Federal Reserve to cut rates sooner, potentially boosting risk assets like Bitcoin by reducing borrowing costs and weakening the value of fiat currencies like the US dollar.
Bitcoin price analysis
By press time, Bitcoin was trading at $63,170 with daily gains of almost 8%. On the weekly chart, BTC is up less than 1%.

Bitcoin seven-day price chart. Source: Finbold
In conclusion, for Bitcoin to initiate a sustained rally, the cryptocurrency requires bullish momentum to drive the asset to $65,000. However, Bitcoin currently remains vulnerable to a potential drop to $60,000.
Disclaimer:The content on this site should not be considered investment advice. Investing is speculative. When investing, your capital is at risk.


