Bitcoin (BTC) and the broader cryptocurrency market are grappling with bearish pressure. Notably, the maiden digital asset is experiencing difficulty sustaining trading levels above $60,000, and some market participants anticipate further downside.
In this line, in a TradingView post on May 10, crypto trading expert TradingShot indicated that, according to technical indicators, Bitcoin might encounter additional losses as it contends with rejection at critical levels.
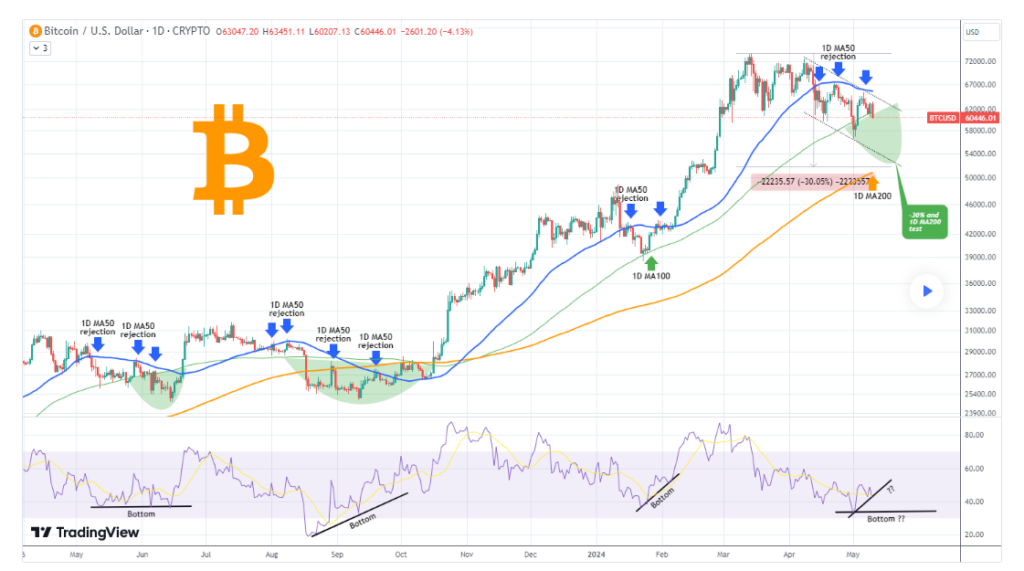
The analyst observed that repeated rejections at the one-day moving average 50 (1D MA50) around the $65,000 position had marred Bitcoin’s recent price action around the $65,000 position. This movement marks the third rejection almost a month since the bearish breakout on April 13.

Bitcoin price analysis chart. Source: TradingView/TradingShot
Therefore, this failure to sustain momentum above this key moving average raises concerns among traders and analysts.
Implication of Bitcoin’s setbacks
Additionally, the analyst noted that Bitcoin’s latest setback has seen it break below the 1D MA100 by around $61,000, a crucial support level. According to TradingShot, this development is far from ideal, potentially paving the way for a lower low in Bitcoin’s price action.
“The technical structure since April 08 is a Channel Down nonetheless, so such feat is certainly possible on the short-term. As you can see from past 1D MA50 bearish break-outs, BTC tends to get more than 2 rejections and excluding January 2024, it has stayed below the 1D MA100 for longer,” the expert said.
What makes the current situation particularly noteworthy is the potential for Bitcoin to experience a significant decline. The expert pointed out that should a lower low be established; Bitcoin would not only test the 1D MA200, around the $50,000 mark, but also approach a nearly 30% decline from its recent record high of above $73,000.
TradingShot underscored that such a decline is not uncommon during bull cycle rallies, suggesting that Bitcoin’s current woes may be part of a broader market correction. However, for investors and traders, the implications of these technical indicators point towards further downside potential for Bitcoin in the near term.
Bitcoin’s bullish sentiments
It’s worth noting that Bitcoin remains entrenched below the crucial $65,000 resistance level as the market anticipates the onset of the post-halving rally. Despite short-term bullish sentiments, Bitcoin has struggled to gain momentum, failing to capitalize on positive news, such as the revelation of banking giant JPMorgan Chase’s (NYSE: JPM) exposure to exchange-traded funds (ETFs).
Notably, the dynamics surrounding ETFs, including inflows and outflows, have influenced Bitcoin’s recent price trajectory.
Despite the prevailing cautious sentiment, an underlying bullish outlook persists within the market. Notably, Jack Dorsey, former CEO of Twitter (now X) and a prominent figure in the cryptocurrency space, voiced optimism, projecting a potential surge for Bitcoin to $1 million by 2030.
Moreover, optimism is bolstered by expectations of the traditional post-halving rally, which historically has injected bullish momentum into Bitcoin’s price.
Bitcoin price analysis
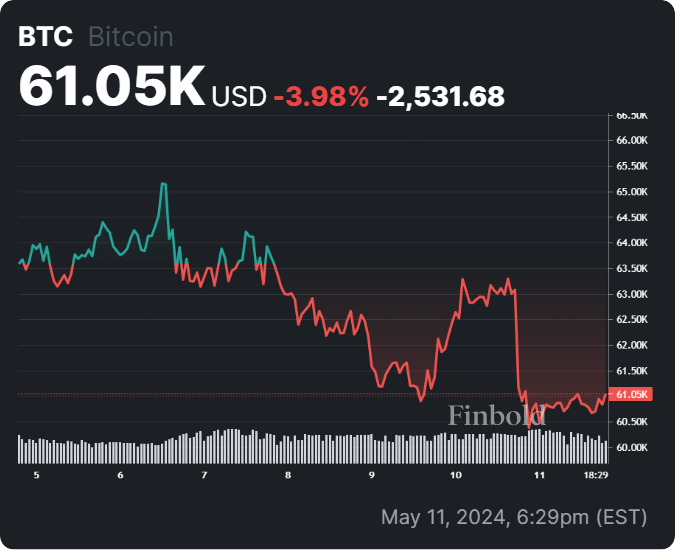
At the time of reporting, Bitcoin was exchanging hands at $61,050, registering a marginal correction of less than 0.1% over the past 24 hours. However, Bitcoin has experienced a decline of nearly 4% every week.

Bitcoin seven-day price chart. Source: Finbold
As Bitcoin navigates through a period of consolidation amidst bearish conditions, investors should also monitor developments in Federal Reserve monetary policies, as they are poised to exert significant influence on risk assets, including cryptocurrencies.
Disclaimer:The content on this site should not be considered investment advice. Investing is speculative. When investing, your capital is at risk.


