Bitcoin (BTC) has seen a notable uptrend this week, propelling the asset’s value to $67,000 as it aims for a new all-time high following a challenging start to May.
One prevailing market sentiment suggests that Bitcoin’s next record-high target is $100,000 (create an alert), with speculation mounting that the milestone might be attained during the projected post-halving rally.
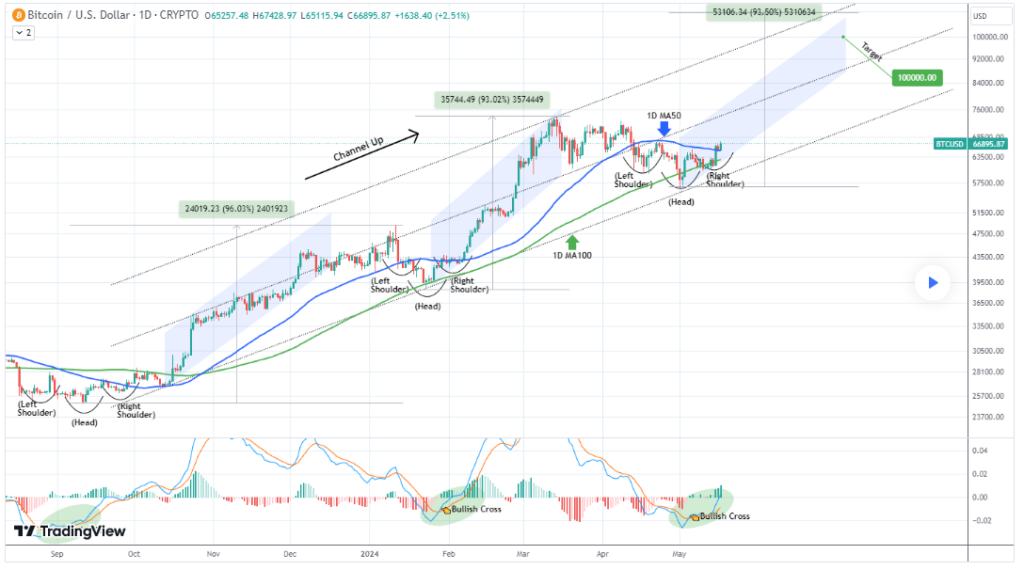
In line with this sentiment, trading expert TradingShot shared insights in a TradingView post on May 18, drawing from Bitcoin’s technical indicators to outline the potential factors that could drive the asset to $100,000 and a possible timeline.

Bitcoin price analysis chart. Source: TradingView/TradingShot
Timeline for Bitcoin to $100,000
Highlighting historical precedents, TradingShot noted that the previous two instances of IH&S bottom formations resulted in significant price rises of around 95%. Moreover, the one-day Moving Average Convergence Divergence (MACD) indicator reinforces the bullish outlook.
Based on this analysis, TradingShot predicted that Bitcoin will likely hit the $100,000 psychological target sometime after July.
“With the 1D MACD on the same Bullish Cross that was present on both of those bottoms, we are expecting the $100,000 psychological target to be reached after July, which will even be a rise below +90%,” the analyst noted.
While the precise timing remains uncertain, the projection underscores Bitcoin’s prevailing bullish sentiment. This sentiment follows a significant correction in early May, with the asset dipping as low as $56,000.
Bitcoin next trading pattern
Indeed, the breach of the $65,000 resistance level was a critical juncture likely to dictate Bitcoin’s trajectory toward a new record high. Notably, the maiden cryptocurrency is consolidating around $67,000, a pattern that some analysts anticipate will continue.
For instance, in a recent X post on May 19, crypto analyst Michaël van de Poppe advised investors not to anticipate further volatility in Bitcoin’s price.
“I’m not expecting massive volatility to come. I’d rather expect consolidation and slow upwards movements towards the all-time high,” he said.
At the same time, according to a report by Finbold, crypto analyst RLinda suggested that Bitcoin bulls could be on the brink of breaking existing resistance levels. In this scenario, she highlighted key resistance levels to monitor at $67,250, $71,500, and $73,700 while emphasizing watching crucial support levels at $65,250, $64,500, and $61,500.
Bitcoin price analysis
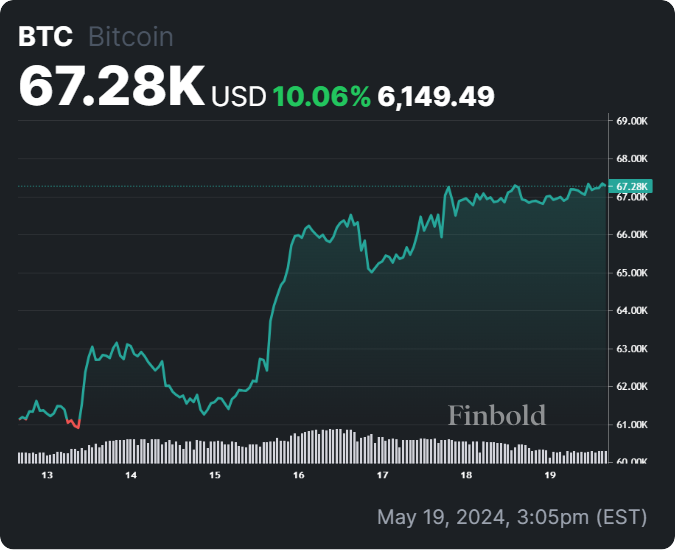
By press time, Bitcoin was trading at $67,280 with daily losses of about 0.12%, while on the weekly chart, BTC is up almost 10%.

Bitcoin seven-day price chart. Source: Finbold
Considering Bitcoin’s recent price movements, bulls face the challenge of maintaining the price above the $67,000 support level for a meaningful upside potential.
Disclaimer:The content on this site should not be considered investment advice. Investing is speculative. When investing, your capital is at risk.


