Bitcoin (BTC) network activity has shown a significant downward trend in the creation of new addresses, reaching its lowest level since July 2018.
Data from market intelligence platform IntoTheBlock reveals a 7-day average of only 276,000 new addresses. This decline suggests fewer new investors are entering the cryptocurrency space.
The “New Addresses” indicator monitors the daily creation of new addresses on the BTC network. When this metric is high, it typically indicates an influx of new investors.

12 year BTC new addresses chart. Source. IntoTheBlock
However, returning investors and holders creating multiple wallets for privacy can also increase this number. Overall, these factors contribute to some level of adoption, suggesting that a high number of new addresses can be a long-term bullish signal for Bitcoin
Decline in new addresses: Analyzing the causes
The recent approval of spot exchange-traded funds (ETFs) by the US Securities and Exchange Commission (SEC) has offered investors a new way to gain exposure to Bitcoin.
These ETFs provide a more traditional investment route, potentially drawing interest away from on-chain Bitcoin transactions and, hence, could cause the observed decline in new addresses.
The high transaction fees that followed the excitement around Runes caused a significant drop in active addresses, with the 7-day moving average falling below 700,000 for the first time since March 2020. Although fees have stabilized, with the average fee dropping from $31.4 on April 23 to $2.97 on May 18, the number of active addresses remains low.
Broader market slowdown

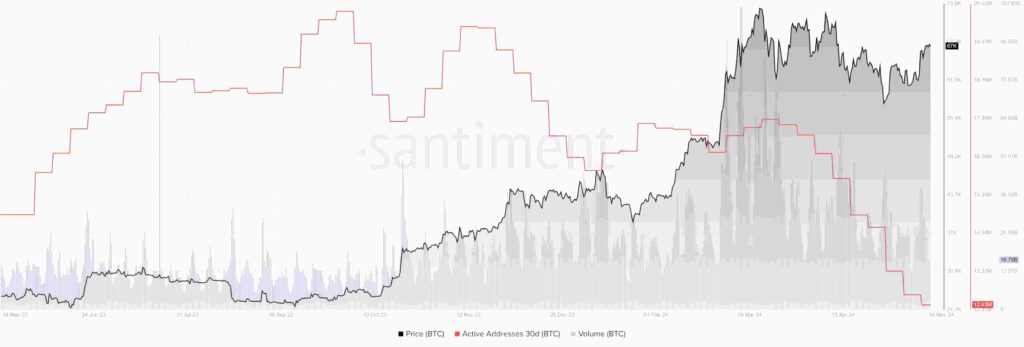
BTC Active Addresses, Price and Volume . Source: Santiment
The broader cryptocurrency market slowdown could also be contributing to the decline.
Lower network activity, indicated by a multi-year low in the 30-day active address count, suggests reduced demand for Bitcoin transactions. This metric, which tracks distinct addresses participating in transactions over 30 days, dropped to 12.64 million, a level last seen in February 2019.
The decrease in new Bitcoin addresses and overall network activity raises questions about the health and demand of the Bitcoin market.
While high network activity typically correlates with increased demand and price stability, the current decline could indicate a shift in investor behavior, possibly towards derivatives speculation rather than organic use.
Bitcoin price analysis
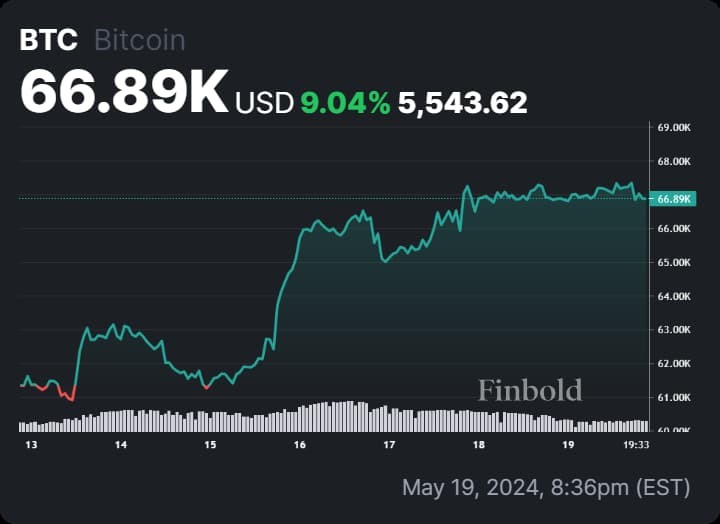
By press time, Bitcoin was trading at $66,897 with daily gain of 0.27%, while on the weekly chart, BTC is up almost 10%.

Bitcoin seven-day price chart. Source: Finbold
The decline in new Bitcoin addresses reflects a complex interplay of factors, including the introduction of spot ETFs, transaction fee dynamics, and broader market trends.
Understanding these elements is crucial for interpreting the current state and future direction of Bitcoin’s market demand.
While the lower number of new addresses might suggest reduced interest, it also highlights evolving investment behaviors and the ongoing impact of transaction fees and market conditions on the cryptocurrency ecosystem.
Disclaimer: The content on this site should not be considered investment advice. Investing is speculative. When investing, your capital is at risk.


