With Bitcoin (BTC) hitting an all-time high of over $73,000 in March, much of the market consensus has focused on $100,000 as the next record price.
This target could become a reality, according to an analysis by crypto trading expert TradingShot, who noted that Bitcoin may be on the brink of a major price surge.
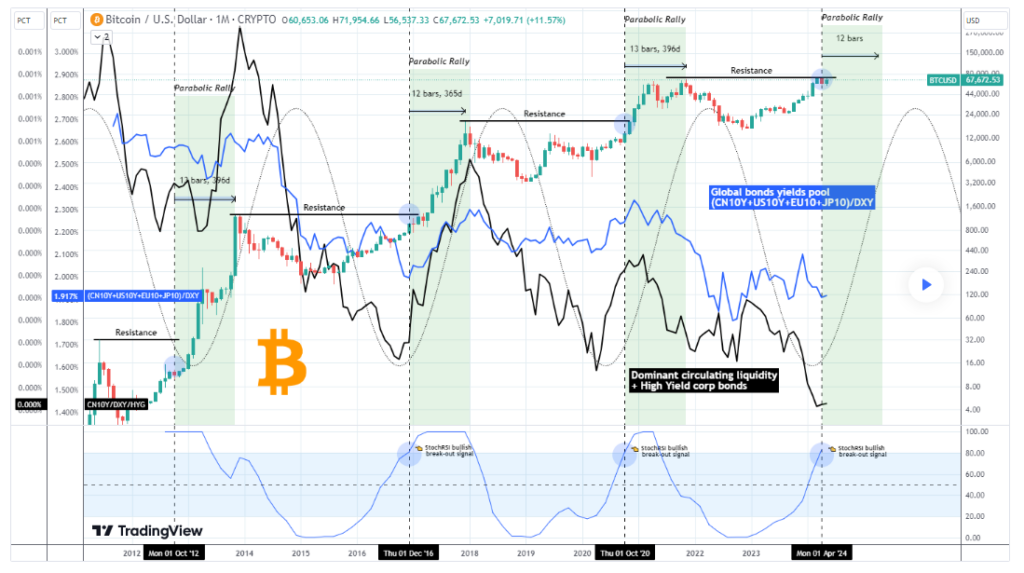
In a TradingView post on May 29, the analyst highlighted several insights suggesting that Bitcoin is entering the final and most aggressive phase of its current bull cycle, the parabolic rally.

Bitcoin price analysis chart. Source: TradingView/TradingShot
According to the analyst, the global bond yield pool has reversed upwards for the first time this year. Historically, such reversals have been precursors to significant upward movements in Bitcoin’s price.
Meanwhile, the dominant circulating liquidity and high-yield corporate bonds indicator reverses upwards after hitting a bottom. Similar bottoms were observed in April 2020, October 2016, and July 2012, followed by substantial Bitcoin rallies.
At the same time, the stochastic relative strength index, a momentum indicator, has just broken above the overbought 80 barrier in the two-month time frame. Historically, this event has been a reliable trigger for bullish reversals in liquidity indicators, typically resulting in Bitcoin reaching a cycle top within the next 12 to 13 months.
TradingShot’s analysis also drew parallels to previous bull cycles in Bitcoin’s history. The reversal in liquidity indicators and the breach of the overbought barrier on the Stoch RSI have historically coincided with massive price surges.
“Every time it has done so historically, it has coincided with a massive bullish reversal on those Liquidity Indicators (LI) and Bitcoin made a Cycle top within 12 – 13 months later. As a result, we are expecting BTC to peak a year from now, around May 2025. Brace yourself for a wild ride ahead,” TradingShot added.
If this projection is realized, it could be a welcome development for Bitcoin investors, considering the asset has returned to the familiar territory of trading around the $67,000 mark. Given the ongoing tussle between bears and bulls, Bitcoin appears to be gearing up for a significant price movement as things stand.
Bitcoin’s extended consolidation
Notably, Bitcoin recently hit $71,500 amid the buzz around the Ethereum (ETH) exchange-traded fund (ETF), which turned out to be another bull trap. Despite this, the bulls managed to hold above $67,000 support.
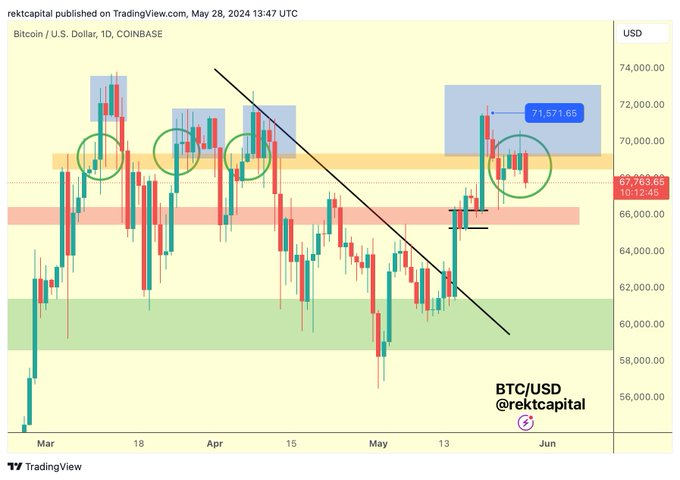
Amid this consolidation, crypto analyst Rekt Capital suggested in an X post on May 28 that investors should expect extended sideways trading around the $60,000 to $70,000 mark before any significant rally.
“Bitcoin is increasingly showing signs that this recent rebound has fed into the formation of another local top (blue square). Ultimately, history suggests Bitcoin is going to likely continue consolidating between ~$60,000 & ~$70,000,” he said.

Bitcoin price analysis chart. Source: TradingShot/Rekt Capital
Bitcoin price analysis
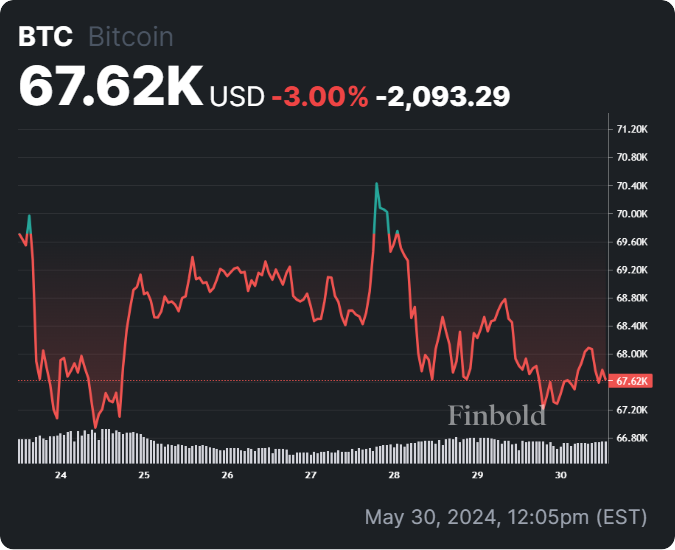
By press time, Bitcoin was trading at $67,620, corrected by less than 0.1% in the last 24 hours. On the weekly chart, BTC is down 3%.

Bitcoin seven-day price chart. Source: Finbold
In the meantime, Bitcoin can realize the parabolic rally if the maiden cryptocurrency manages to break and sustain its price above the $70,000 mark.
Disclaimer:The content on this site should not be considered investment advice. Investing is speculative. When investing, your capital is at risk.


