Solana (SOL) has exhibited a bullish bias for most of 2024, with the decentralized finance (DeFi) token surging over 170% in the last six months.
Amid bullish sentiments primarily driven by increased activity on the Solana blockchain, the $200 price target has become a key goal for the asset. Investors believe that reclaiming the $200 mark will pave the way for another all-time high.
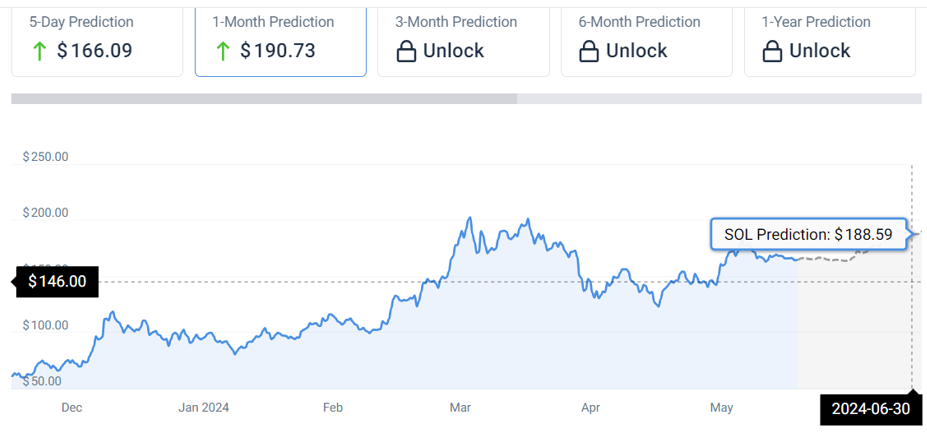
To determine the next SOL price trajectory, Finbold consulted artificial intelligence (AI) that leverages machine learning algorithms to gather insights into the asset’s potential valuation at the end of the month.

Solana price prediction. Source: CoinCodex
Technical analysis take on Solana’s price
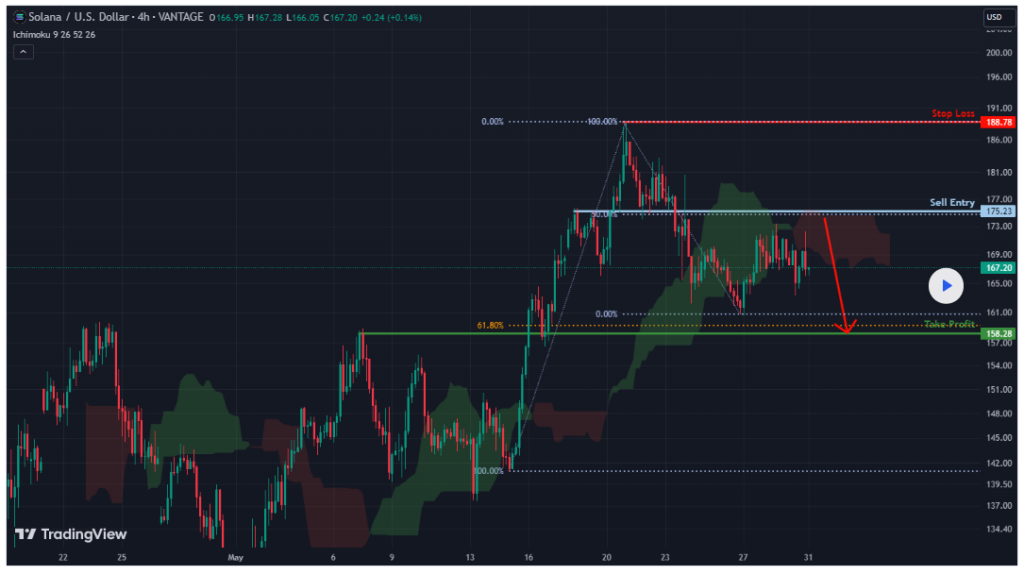
In addition to the AI price projection, analysts at Vantage Markets shared insights into key price levels to watch. In a TradingView post on May 31, the analysts noted that SOL is approaching a critical resistance level aligned with the 50% Fibonacci retracement, indicating a potential reversal.
The experts suggested that traders consider entering at $175.23, targeting this overlap resistance for its strategic significance. The stop loss is set at $188.78, where a pullback resistance level provides a safeguard.

Solana price analysis chart. Source: TradingView
Overall, Solana’s price movement has been heavily influenced by on-chain activity, with the meme coin frenzy being a significant driver. The price has rallied thanks to surging investor interest in Solana-based memecoins like Dogwhifhat (WIF) and Bonk (BONK). This frenzy has boosted Solana’s network activity, leading to increased transactions and revenues.
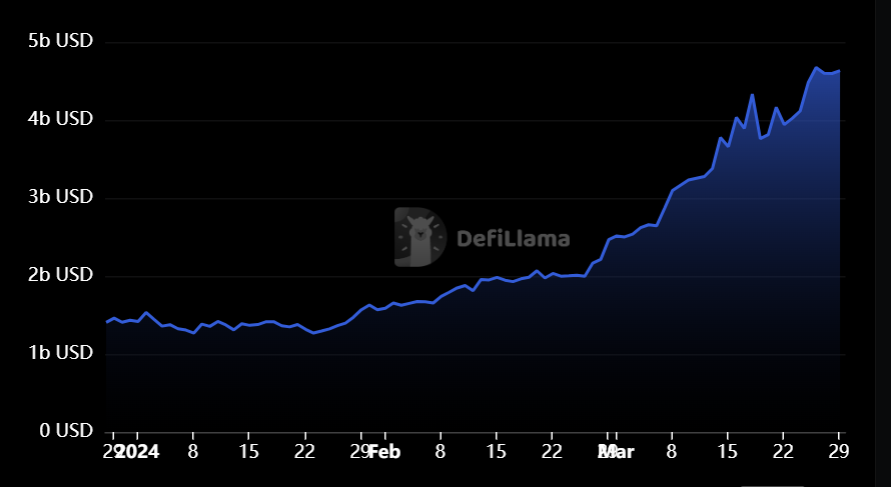
Additionally, the influx of new meme coins has significantly enhanced the total value locked (TVL) across the Solana ecosystem. According to data from DefiLama, Solana’s TVL stands at $4.787 billion, having surged 239% in 2024.

Solana YTD TVL chart. Source: DefiLlama
Solana price analysis
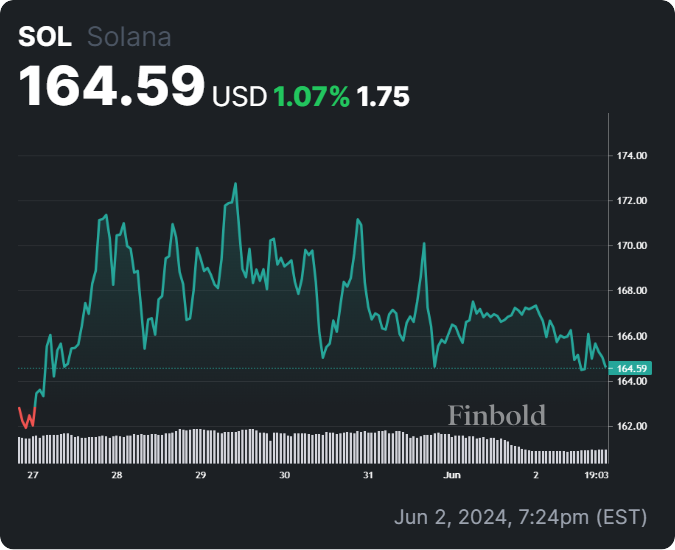
As of press time, Solana was trading at $164, with a 24-hour correction of almost 1.5%. Over the past seven days, the cryptocurrency has gained about 1%.

Solana seven-day price chart. Source: Finbold
Meanwhile, Solana’s technical indicators remain largely bullish for the next month. Data from TradingView shows that a summary of the 30-day technical indicators aligns with a ‘buy’ sentiment at 9 while moving averages indicate a ‘strong buy’ at 7. Oscillators recommend ‘buy’ at 2.

Solana technical analysis. Source: TradingView
Overall, with Solana dominated by bullish sentiments, the token’s bulls must sustain the price above the $160 support to realize steady upward momentum.
Disclaimer:The content on this site should not be considered investment advice. Investing is speculative. When investing, your capital is at risk.


