Cryptocurrency trading expert Michaël van de Poppe believes that Bitcoin (BTC) is destined for further correction after failing to breach the $71,000 resistance level.
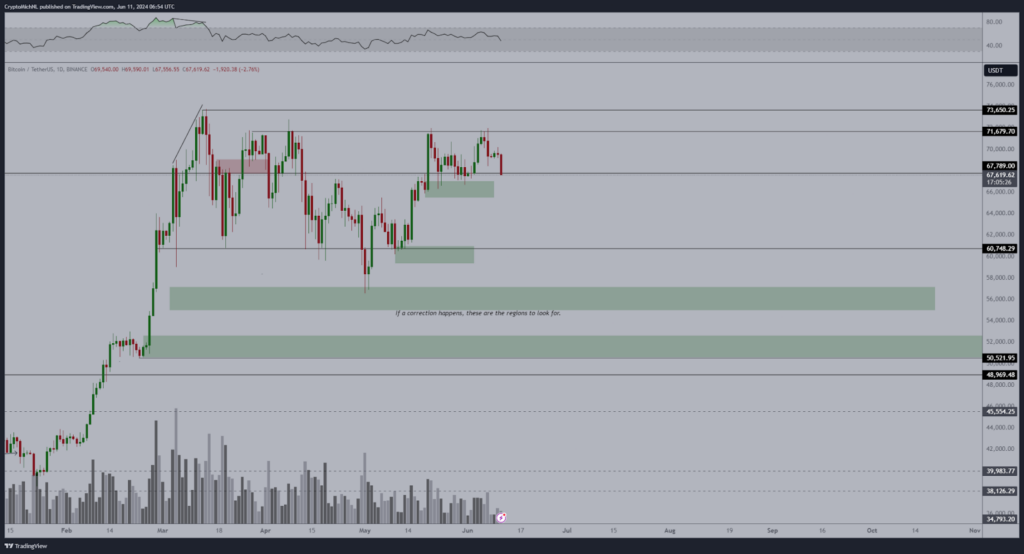
In an X post on June 11, Poppe identified several critical price levels and areas of interest for investors to watch. He pointed out that Bitcoin is expected to test the support range between $64,000 and $65,000.
As per the analysis, this range is crucial as it could be a strong foundation for Bitcoin’s price to stabilize before attempting another upward move. Should the price drop below this immediate support, Poppe indicates a significant demand zone of $54,000 to $56,000.

Bitcoin price analysis chart. Source: TradingView/Michaël Poppe
Successfully overcoming this barrier could pave the way for Bitcoin to retest its previous highs and potentially aim for new record levels.
Impact of CPI data
The analyst added that the upcoming Federal Open Market Committee (FOMC) meeting and the release of Consumer Price Index (CPI) data are critical events that could influence Bitcoin’s price movement. He anticipates that these events might trigger increased volatility in the market, potentially driving the next significant price action.
“Bitcoin continues to fall after rejecting the $71K area. Expecting that we’ll see tests at $64-65K before the markets are reversing back upwards due to the upcoming FOMC meeting & CPI data,” he said.
The chart shows a consistent volume pattern, indicating steady trading activity. However, increased volume will be necessary to support a sustained upward move.
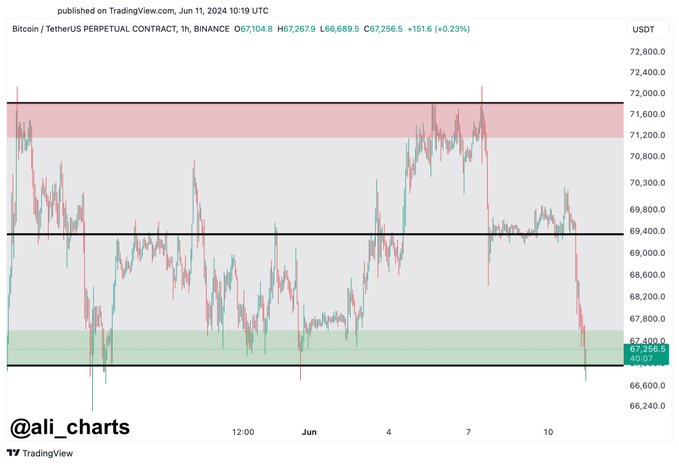
On the other hand, crypto analyst Ali Martinez pointed out that Bitcoin was trading within a well-defined parallel channel. According to Martinez, when Bitcoin trades in such a pattern, one should buy Bitcoin at the lower boundary and sell at the mid or upper boundary.
In this case, Bitcoin’s lower boundary is around $67,000, marked as a strong support level where buying opportunities are highlighted. The mid boundary is approximately $69,000, an intermediate point for partial profit-taking. The upper boundary is close to $71,000, which is identified as the resistance level where selling or taking profits is recommended.

Bitcoin price analysis chart. Source: TradingView/Ali_Charts
It’s worth noting that Bitcoin attempted to break from the consolidation phase that has characterized the asset in recent days. The drop followed $64.9 million in outflows from U.S. spot Bitcoin exchange-traded funds (ETFs). The movement marked the first loss since at least May 23.
Bitcoin price analysis
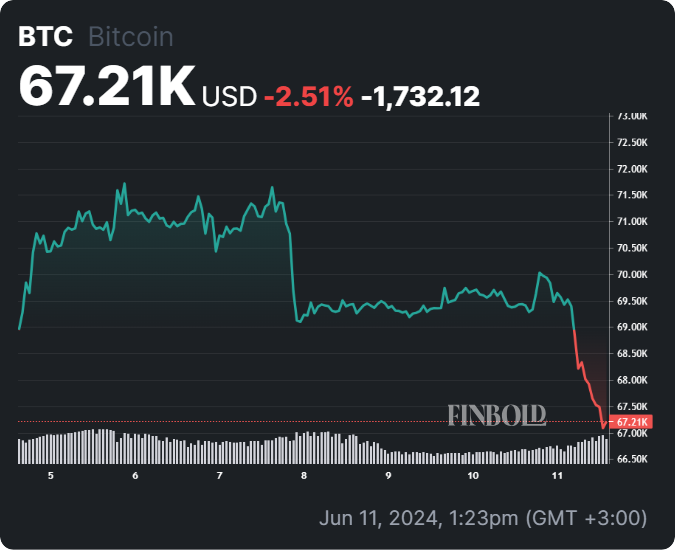
Bitcoin was trading at $67,210 by press time, having plunged by over 3% in the last 24 hours. On the weekly chart, Bitcoin is down 2.5%.

Bitcoin seven-day price chart. Source: Finbold
Overall, with bears seemingly taking charge of Bitcoin in the last 24 hours, the focus is on Bitcoin to sustain its price above $65,000, as dropping below this level will open room for further losses.
Disclaimer:The content on this site should not be considered investment advice. Investing is speculative. When investing, your capital is at risk.


