As Bitcoin (BTC) struggles to maintain its price above $67,000 with a target of $70,000, a crypto trading analyst has identified technical indicators that point to a new all-time high.
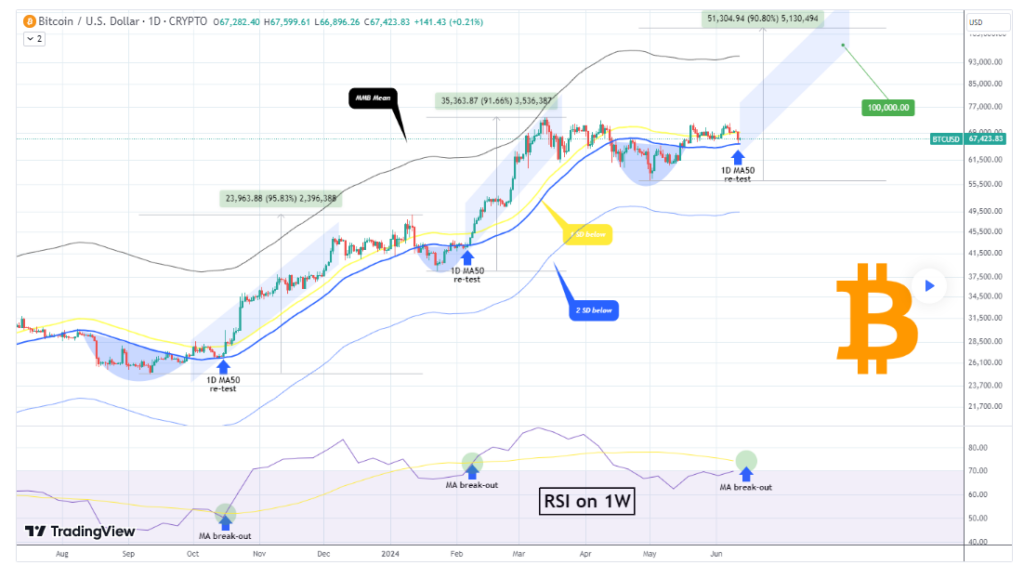
In a June 12 TradingView post, the analyst TradingShot noted that Bitcoin is poised to reach $100,000, the next possible high target.
The expert observed that Bitcoin has been practically consolidating since the May 21 high of above $71,000, and the recent pullback over the past five days is starting to inflict a certain degree of fear in the market again.

Bitcoin price analysis chart. Source: TradingView/TradingShot
The market expert segmented Bitcoin’s price action into phases, trading within the Mayer Multiple Bands (MMB) Mean and the MMB 2SD below. Historically, after each test of the 1D MA50, Bitcoin has entered an upward channel approaching the MMB.
Bitcoin’s path to $100,000
Therefore, TradingShot noted that the final parameter needed to confirm the start of this upward channel, which could propel Bitcoin toward the $100,000 mark, is for the one-week Relative Strength Index (RSI) to break above its moving average level.
“The only parameter that’s left to confirm the start of this (blue) Channel Up that will test the MMB is the 1W RSI to break above its MA level (yellow trend-line). As you can see 100k following that, is a rather conservative technical Target within this pattern,” the analyst noted.
According to TradingShot’s analysis, a breakout of the weekly RSI above its MA level would likely signal a solid bullish trend, making the $100,000 target a conservative estimate.
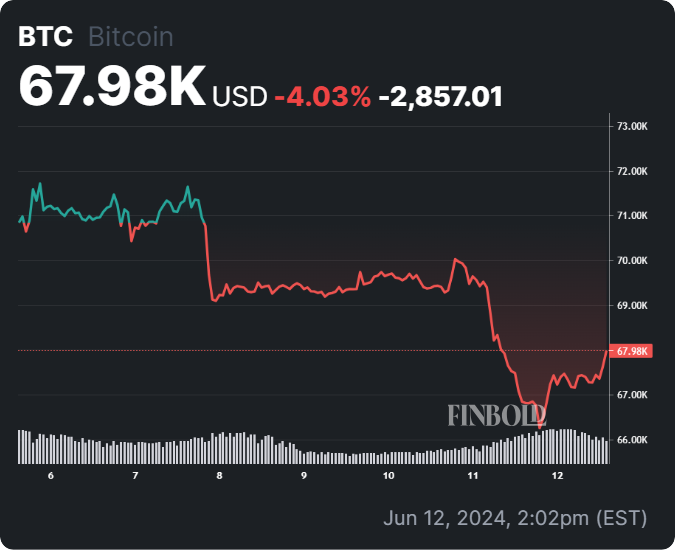
Notably, after Bitcoin rejected $71,000, the asset dropped to $67,000, where the maiden cryptocurrency has been consolidating for days. In the past 24 hours, Bitcoin dropped below $67,000 to a low of approximately $66,800.
It’s worth noting that the brief sell-off coincided with a day when United States-listed spot Bitcoin exchange-traded funds (ETFs) recorded a second-straight day of outflows. The ETFs recorded $200 million in net outflows on June 11, the highest since the May 1 figure of $580 million.
In the meantime, the market remains jittery regarding how key macroeconomic data will impact Bitcoin. Notably, the market is looking forward to the release of the CPI data and the outcome of the Federal Open Market Committee (FOMC) meeting. The Fed will decide the next monetary policy after the meeting.
Bitcoin price analysis
As of press time, Bitcoin traded at $67,980, dropping by over 1% in the last 24 hours. On the weekly chart, BTC is down 4%.

Bitcoin seven-day price chart. Source: Finbold
At the moment, investors will be monitoring Bitcoin’s immediate support level of around $67,000, with stronger support at $65,500 if the former fails. On the resistance side, $69,000 is the immediate level to watch, followed by the more critical $70,000 mark.
Finally, the price action in the next few days will likely revolve around these levels, with breaks above resistance potentially leading to bullish momentum and breaks below support indicating further bearish trends.
Disclaimer: The content on this site should not be considered investment advice. Investing is speculative. When investing, your capital is at risk.


