Bitcoin (BTC) has moved from $72,000 to $65,000, for 10% losses in the last 12 days. This has affected Wall Street’s conviction in the cryptocurrency, with Bitcoin spot ETFs registering four consecutive days of selling pressure.
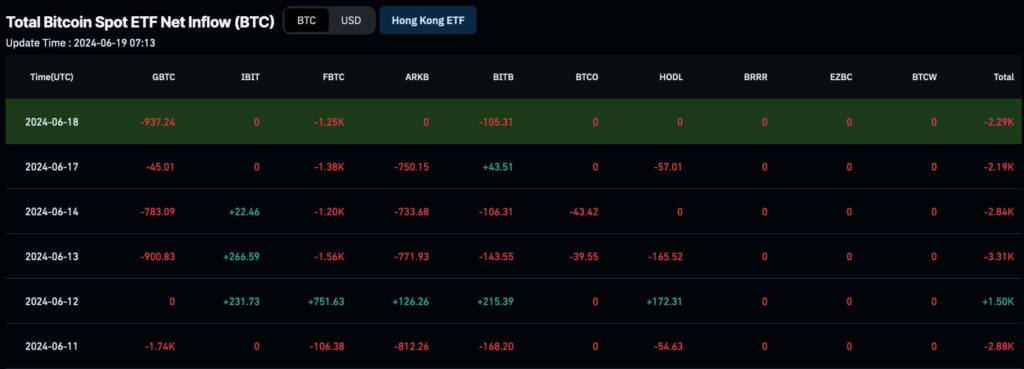
Notably, the last four days resulted in a 10,630 BTC outflow worth over $700 million from the 10 ETFs. Finbold retrieved this data from CoinGlass on June 19, looking for insights on Wall Street’s sentiment over having Bitcoin exposure.
In particular, Fidelity’s FBTC dominated Wall Street’s selling activities with more than 50% of the daily outflows. The investment firm removed 5,390 BTC from its exchange-traded fund, while others had moderate or no flow.

Total Bitcoin Spot ETF Net Inflow (BTC). Source: CoinGlass
Bitcoin ETFs holdings
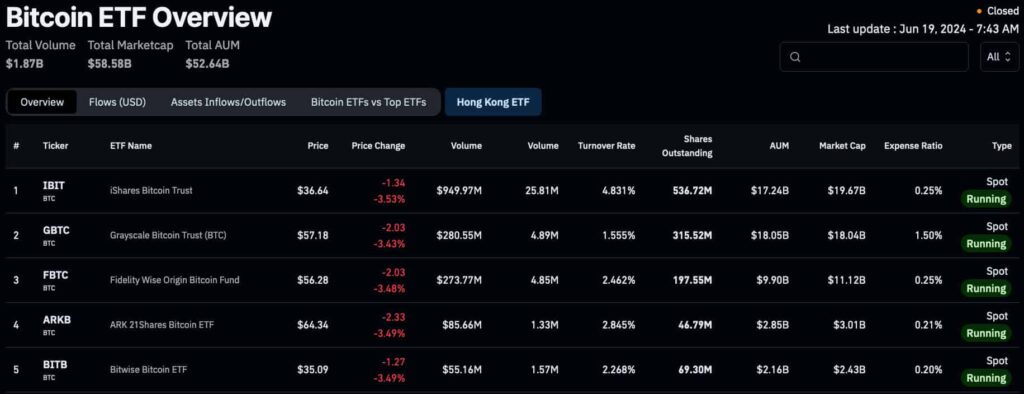
The Wall Street derivatives of the leading cryptocurrency sum up to a $58.58 billion market cap, with the funds holding $52.64 billion in assets under management (AUM) and a daily volume of $1.87 billion.
IBIT leads the market with a $19.65 billion capitalization and $17.24 billion AUM. GBTC follows closely, with a $18.04 billion market cap and a higher $18.05 billion AUM.

Bitcoin ETF Overview. Source: CoinGlass
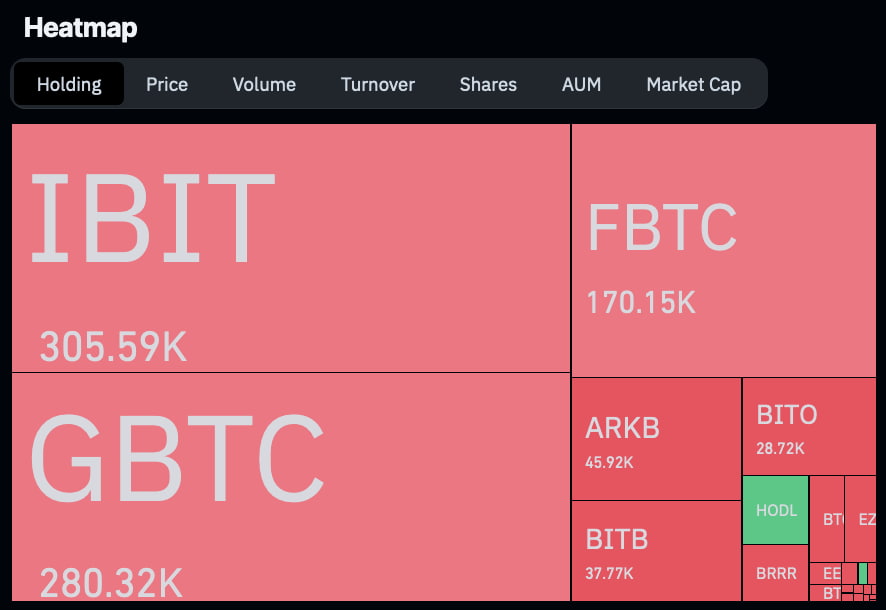
As for the holdings, BlackRock’s iShares company currently has 305,590 BTC, followed by Grayscale with 280,320 BTC. Additionally, Fidelity is the third-largest holder with 170,150 BTC, and all other funds have less than 50,000 BTC.

Bitcoin ETF Heatmap, holding. Source: CoinGlass
Bitcoin price analysis and Wall Street impacts
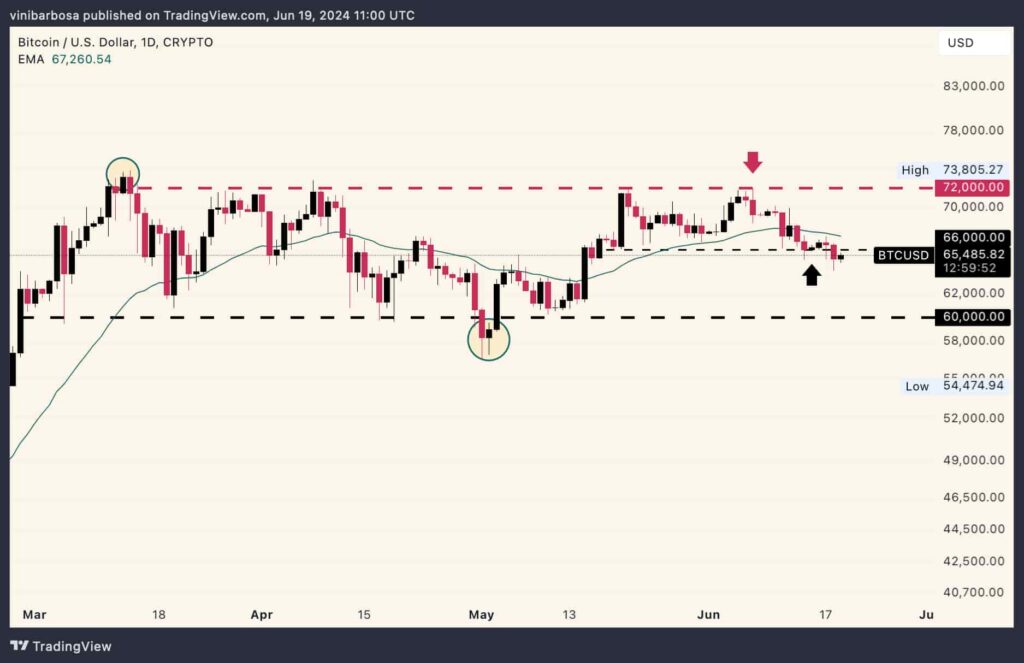
Meanwhile, Bitcoin is trading at $65,485, struggling with key support level marking the bottom of a tighter range. If BTC fails to recover the $66,000 zone, it could head to a four-month range and psychological support at $60,000, bringing more losses for its investors.
Moreover, the leading cryptocurrency has lost its 30-day exponential moving average, showing weakness and a lack of momentum. This happened after BTC failed to break the $72,000 resistance for the fifth time in the last four months.

BTC/USD daily price chart. Source: TradingView / Finbold
Therefore, this technical analysis aligns with the outflow trend spotted within the Wall Street Bitcoin derivatives, which are laggard indicators. Essentially, ETF traders buy and sell shares of the funds with no direct impact on the spot, which is later settled by the issuers by selling or buying real Bitcoin.
You read it right: BlackRock has been settling its BTC transactions with Coinbase without using Bitcoin's settlement network.We are not talking about "buying a coffee," but institutional settlements of a $18.5 billion fund.The reason: Transaction speed and fees.Got it now?… pic.twitter.com/SxzAcHyzlJ
— Vini Barbosa (@vinibarbosabr) May 20, 2024Nevertheless, the funds’ flows indicate the most recent activity from Wall Street traders speculating on Bitcoin. Furthermore, they indicate what the firms managing these funds forecast for the future of BTC as they could absorb the shares.
Looking at these highly capitalized traders from traditional finance can give valuable insights for the future. Besides Wall Street, Bitcoin native miners have also been selling BTC faster in the last few months, signaling capitulation.
Investors must be cautious with their exposure to mostly speculative cryptocurrencies like Wall Street’s Bitcoin, considering the inherent risks of this market. On the other hand, investors can look for utility-focused projects, gathering organic demand and adoption from users worldwide.


