The recent Bitcoin (BTC) price movement has captured significant attention from investors and traders alike.
Veteran trader Peter Brandt has pinpointed a potential buying opportunity, referred to as a “footshot,” which he interprets as a short-term buy signal. This comes at a critical time when Bitcoin is struggling with volatility and finding stable support levels.

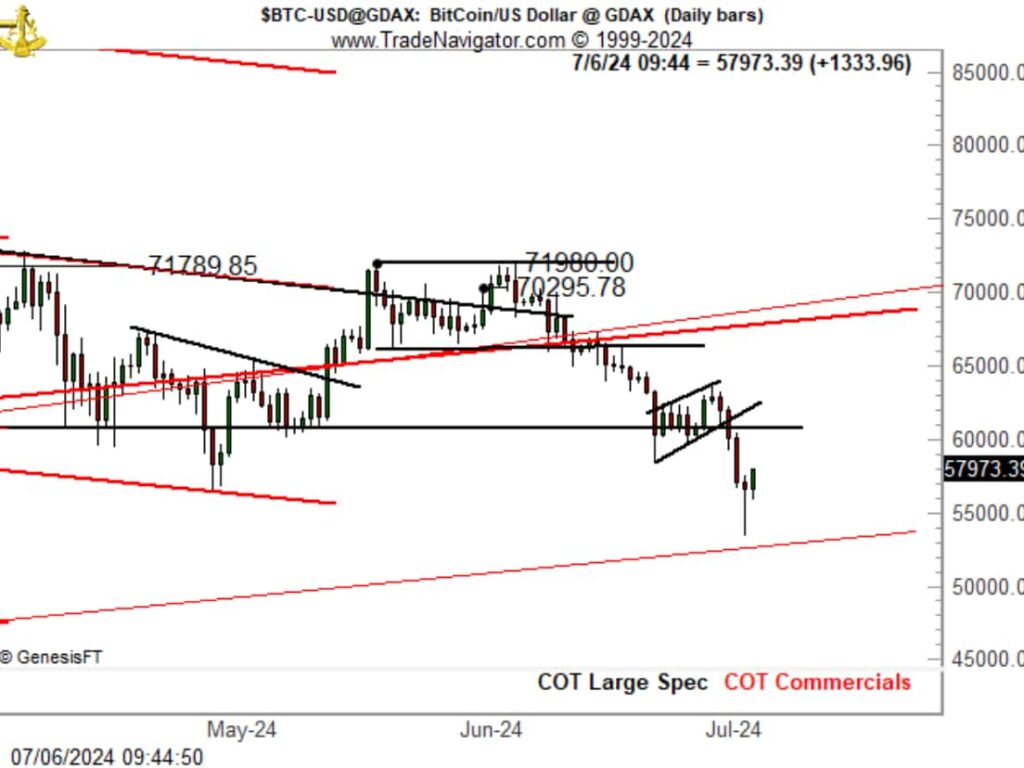
BTC price analysis. Source: Peter Bandt / X
Bitcoin previously peaked at $71,789.85 and $74,980.00, indicating strong resistance at these levels. As of July 6, 2024, Bitcoin is trading at $57,973.39, marking a significant decline from these highs.
The chart suggests a bearish trend over the past few months, with Bitcoin experiencing a sharp decline from the 70,000 range and breaking through multiple support levels.
Recently, the price dipped below $60,000, reaching a low near $55,000 before recovering to $57,973.39. A notable consolidation pattern, possibly a wedge, appears before the recent sharp drop, indicating market indecision prior to the downward move.
The support level around $57,973.39 is crucial, as it appears to be holding after the recent decline.
Understanding the ‘Footshot’ buying opportunity
Brandt refers to this pattern as a “foot shot,” which he interprets as a short-term buy signal. This term likely refers to a significant drop in price, presenting a unique buying opportunity for several reasons.
The sharp decline could be due to short-term negative sentiment, causing an overreaction. Such drops often lead to prices falling below their intrinsic value.
The current support level around $57,973.39 appears to be holding strong. If this level continues to hold, it suggests a potential bottom where buyers are stepping in, creating a favorable entry point.
Buying near strong support levels can offer an advantageous risk-reward ratio. If the support holds, the potential upside is significant, especially if the price retraces back to previous resistance levels around $70,000 or higher.
Bitcoin price analysis
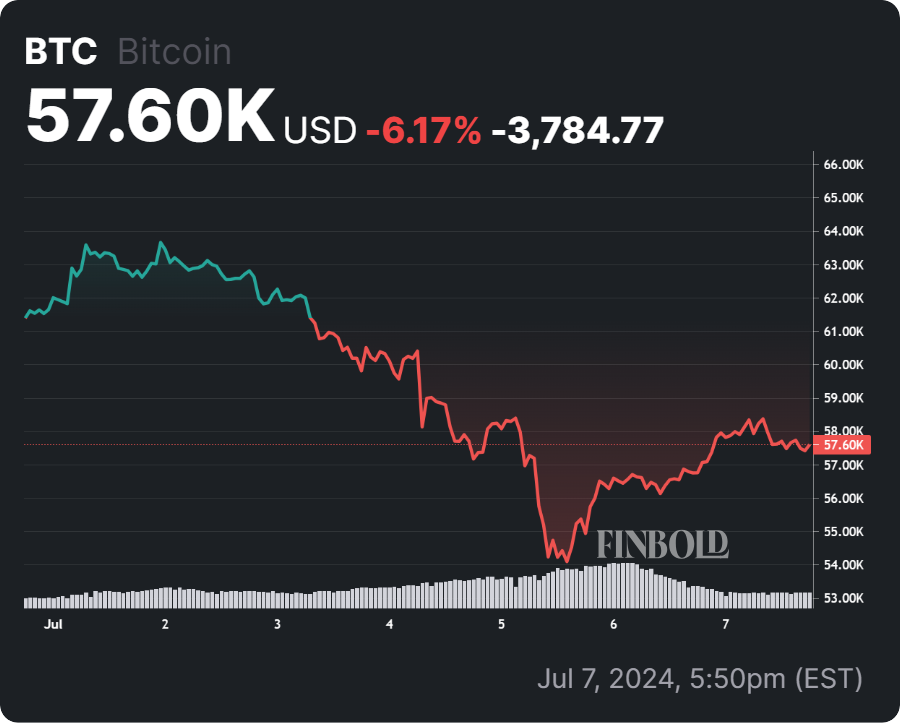
At the press time, Bitcoin is currently trading at $57,609 with a one-day gain of 1%.

BTC 7-day price chart. Source:Finbold
For long-term investors, the current situation presents an ideal accumulation phase. Investors should consider gradually accumulating Bitcoin at these lower levels, especially if the support of around $57,973.39 continues to hold. Allocating a portion of capital to buy on dips can help average the entry price.
For short-term traders, employing technical analysis to identify oversold conditions and potential reversal points is crucial.
Utilizing indicators such as the Relative Strength Index (RSI) and Moving Averages (MAs) can provide valuable insights. Monitoring volume is also essential to ensure that the buying pressure at the support level is strong.
In conclusion, the “footshot” pattern identified by Peter Brandt highlights a potentially significant buying opportunity for both long-term investors and short-term traders.
By leveraging technical analysis and understanding market sentiment, investors can make informed decisions to optimize their Bitcoin holdings.
Disclaimer: The content on this site should not be considered investment advice. Investing is speculative. When investing, your capital is at risk.


