XRP has enjoyed a bullish run in recent days as the token aims to maintain gains above $0.60, with an analyst suggesting there is more room for upside potential.
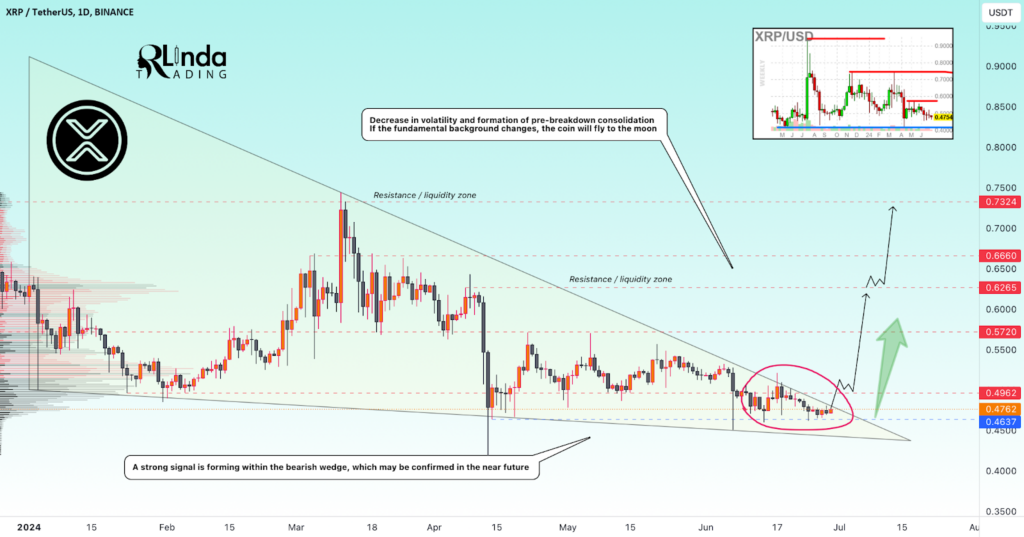
Particularly, in a TradingView post on July 25, RLinda noted that XRP is displaying a critical formation that suggests a significant potential breakout.
This technical insight, combined with optimistic statements from Ripple’s CEO about an imminent resolution to the ongoing legal battle with the Securities and Exchange Commission (SEC), could boost the token.

XRP price analysis chart. Source: TradingView/RLinda
According to RLinda, key levels to watch include resistance at $0.6378 and $0.7440 and support at $0.5712 and $0.5100. If XRP breaks above the resistance at $0.6378, it could signal a robust upward trajectory, potentially leading to a significant rally.
“The moment before to the moon. <…> Technically, it is worth paying attention to the 0.6378 – 0.5712 range. If breaking the resistance fails, the price may test liquidity below the support before subsequent growth,” the expert noted.
On the other hand, if the resistance fails, the price might test liquidity below the support at $0.5712 before any subsequent growth.
The analyst also pointed out that market dynamics favor a bullish outlook. Increased trading volumes indicate growing interest and confidence among market participants. Notably, recent price movements have seen XRP reach local highs, reflecting bullish sentiment. Furthermore, large holders are accumulating the token, signaling confidence in its future performance.
Meanwhile, attention remains on the outcome of the SEC case, with speculation suggesting that the two parties might settle in a closed-door meeting on July 25.
XRP’s consolidation signals breakout
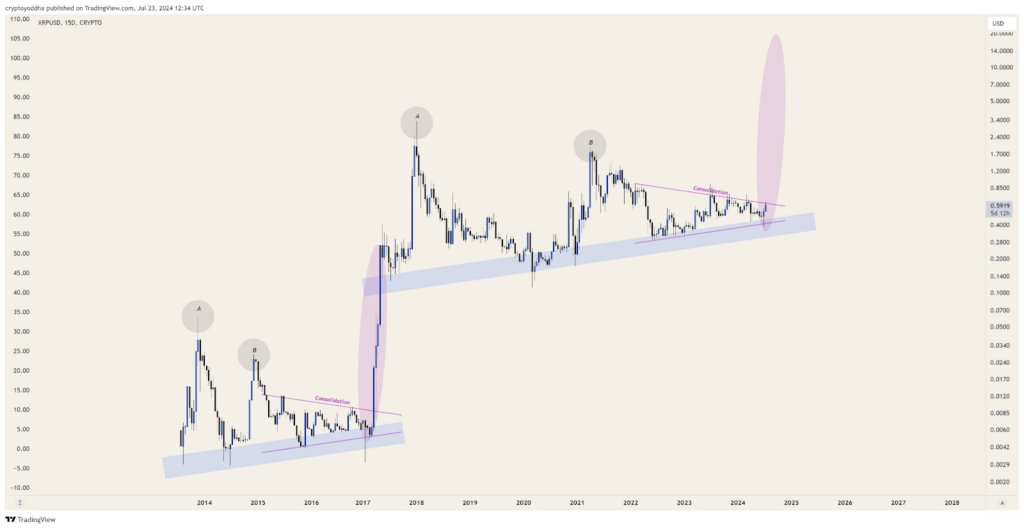
Elsewhere, according to crypto analyst CryptoYoddha in an X post on July 23, XRP might be primed for a rally after consolidating. The analysis revealed a consistent ascending trendline, serving as robust support since around 2014-2015. This trendline has been repeatedly tested, reinforcing its significance as a key support level.
Over the past decade, XRP has experienced three distinct market cycles: a sharp increase and correction from 2014 to 2017, higher peaks and subsequent correction from 2017 to 2020, and a current cycle of consolidation with a gradual upward trend extending into 2024.

XRP price analysis chart. Source: TradingView
Each cycle’s peak shows a pattern of progressively higher highs, suggesting a sustained uptrend. Resistance levels have previously impeded price increases. However, the analysis suggested a potential breakout from the current consolidation phase, with projections indicating possible significant upward movement that could surpass previous highs.
XRP price analysis
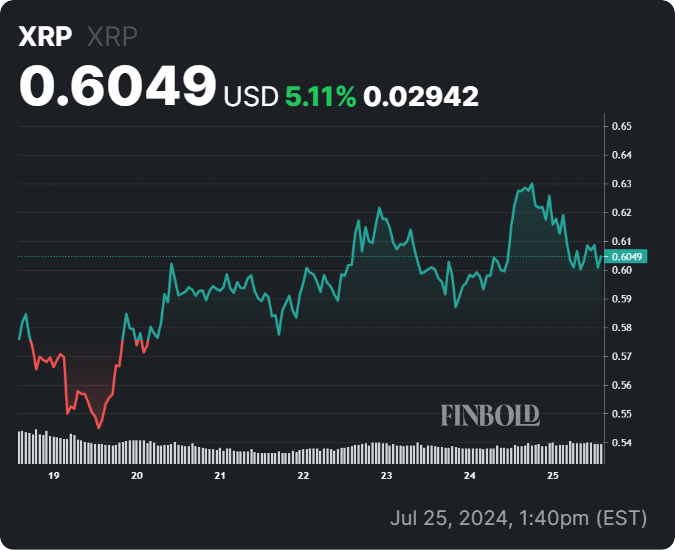
As of press time, XRP was trading at $0.60, impacted by the general slowdown in the crypto market. Notably, over the past 24 hours, the token has been down over 3%, while in the weekly timeframe, XRP has rallied over 5%.

XRP one-week price analysis chart. Source: Finbold
Overall, attention is now focused on XRP’s ability to maintain the current $0.60 support amid market fluctuations.
Disclaimer: The content on this site should not be considered investment advice. Investing is speculative. When investing, your capital is at risk.


