It has emerged that Bitcoin (BTC) whales have taken advantage of the recent sell-off to accumulate the maiden cryptocurrency, suggesting a possible upcoming price breakout.
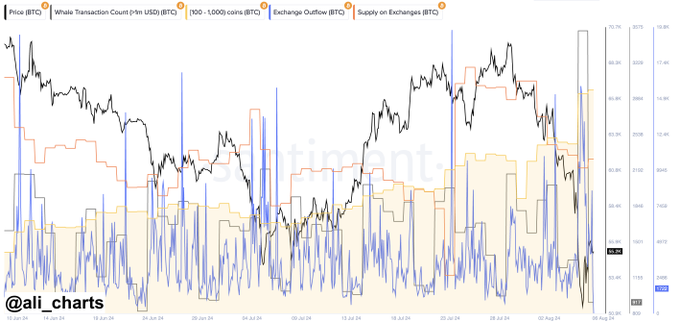
The whales’ purchases are highlighted by data shared by crypto analyst Ali Martinez in an X post on August 4, where the large holders acquired over 30,000 BTC, amounting to approximately $1.62 billion in 48 hours.
Indeed, the massive buying spree is highlighted by a surge in exchange outflows and a notable decrease in BTC supply held on trading platforms.

Bitcoin whale transactions chart. Source: Santiment/Ali_Charts
“In the past 48 hours, Bitcoin whales acquired over 30,000 BTC, valued at approximately $1.62 billion. This is evident from the surge in exchange outflows and the decrease in BTC supply held on exchanges,” Martinez stated.
Notably, the purchase came when Bitcoin experienced a significant price fluctuation below the $60,000 mark. Over the period, Bitcoin supply on exchanges has been steadily declining, indicating that whales are moving their holdings off exchanges and into long-term storage. The amount involved holdings of 100-1,000 BTC.
Considering that Bitcoin and the general cryptocurrency market have suffered notable losses in recent days, this trend of whale accumulation often precedes price rallies. Notably, large holders tend to accumulate assets during periods of price consolidation before a significant upward movement.
The current scenario suggests that whales are positioning themselves for a potential price surge, reducing the available BTC supply on exchanges and increasing the asset’s scarcity.
Bitcoin’s next key targets to watch
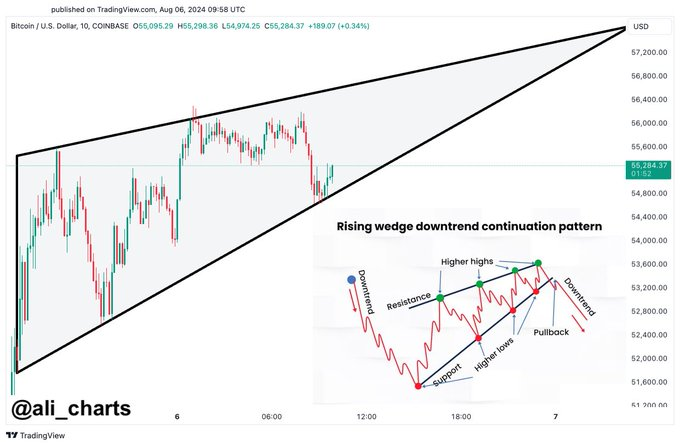
At the same time, in a separate post, Martinez also highlighted what to expect regarding Bitcoin price movement. He pointed out that Bitcoin is exhibiting a rising wedge pattern in the near term, a technical formation often associated with downtrends.
This pattern, characterized by higher highs and higher lows converging towards an apex, suggests a potential bearish reversal.
Currently, Bitcoin is trading around $55,000, showing signs it might climb further to the wedge’s upper boundary, approximately $56,000 to $57,000.
However, according to the analyst, traders should be cautious as a breakdown from this pattern could lead to a significant pullback, potentially bringing Bitcoin down to around $51,000.

Bitcoin price analysis chart. Source: TradingView/Ali_charts
The rising wedge pattern typically indicates that the upward momentum is weakening, and sellers might soon overpower buyers, leading to a downward price movement.
Bitcoin price analysis
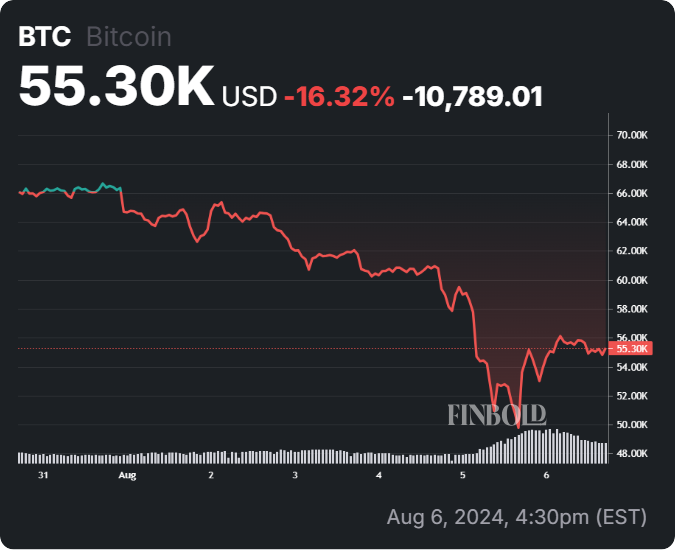
Meanwhile, at the time of reporting, Bitcoin was trading in the green on the daily chart, with gains of over 7% and a valuation of $55,300.

BTC seven-day price chart. Source: Finbold
Considering all factors, Bitcoin is now heavily reliant on the bulls to sustain the current momentum around the $55,000 support level and keep hopes of pushing for the $60,000 level.
Disclaimer:The content on this site should not be considered investment advice. Investing is speculative. When investing, your capital is at risk.


