Amid an exceptionally volatile period for most assets in the cryptocurrency sector, Chainlink (LINK) has struggled to maintain its footing.
The week began with a sharp market-wide crash, and Chainlink was no exception, with its price plummeting toward the $8 level after holding above $11 just days earlier.
However, as the broader market began to recover, LINK quickly reclaimed the $10 mark, signaling resilience in the face of uncertainty.

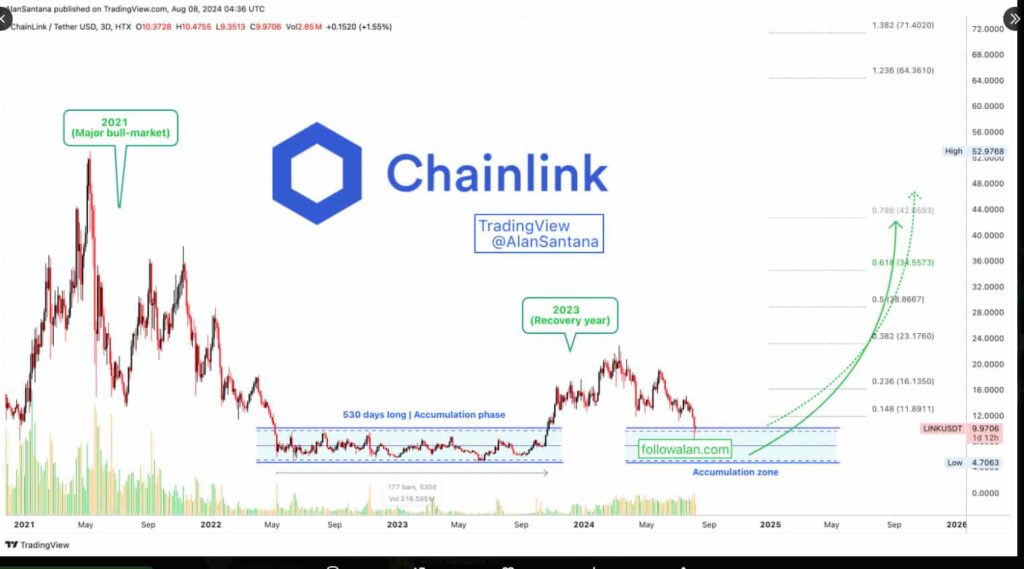
Chainlink price analysis chart. Source: TradingView/Alan Santana
As Chainlink moves out of the accumulation phase, several key resistance levels have been identified using Fibonacci retracement levels. The first notable resistance is around the $16.13 mark, corresponding to the 23.6% Fibonacci level, where initial selling pressure might occur.
Further up, resistance at $23.17 and $28.86, corresponding to the 38.2% and 50% Fibonacci levels, respectively, will be crucial barriers that LINK needs to overcome to maintain its upward momentum.
A breakthrough beyond these levels could propel LINK to $34.55 and ultimately to $42.59, the 61.8% and 78.6% Fibonacci levels, respectively. Projections suggest that LINK could reach as high as $85, with the potential for even higher gains up to $135 if market conditions are favorable.
LINK price analysis and growing network activity
Currently, LINK is trading at $10.29 with a 24-hour increase of 1.13%. Recent data from IntoTheBlock reveals that the number of active LINK addresses has reached its highest level since May.
This increase in new addresses suggests growing user interest, which could drive demand and price appreciation.
The number of active $LINK addresses has reached its highest level since May. Interestingly, this surge occurred alongside a general outflow from exchanges, suggesting accumulation during yesterday's troubled market pic.twitter.com/rpIXkrW00c
— IntoTheBlock (@intotheblock) August 6, 2024Over the last three months, there was a significant spike in active addresses around late May and early June, coinciding with a peak in LINK’s price, reinforcing the idea that increased network activity can drive price appreciation.
Following this spike, there was a steady decline in both active addresses and prices, indicating reduced market engagement.
However, by early August, there is a slight uptick in active addresses, aligning with recent data suggesting a resurgence in user interest.
This increase could signal the beginning of a price recovery, supporting Alan Santana’s bullish projections for LINK.
The data highlights the critical role that network activity plays in shaping Chainlink’s market trajectory, reinforcing the notion that growing user interest and active participation are key drivers of potential price increases as LINK approaches the anticipated 2025 bull market.
Disclaimer: The content on this site should not be considered investment advice. Investing is speculative. When investing, your capital is at risk.


