As Solana (SOL) shows potential for continued bullish momentum in search of reclaiming the $200 resistance, an analyst has warned that investors should be ready for a possible bumpy ride ahead.
Specifically, crypto trading expert Alan Santana has observed that Solana, the decentralized finance (DeFi) token, exhibited a significant bearish signal in August 2024 that could suggest a deeper decline in its price.
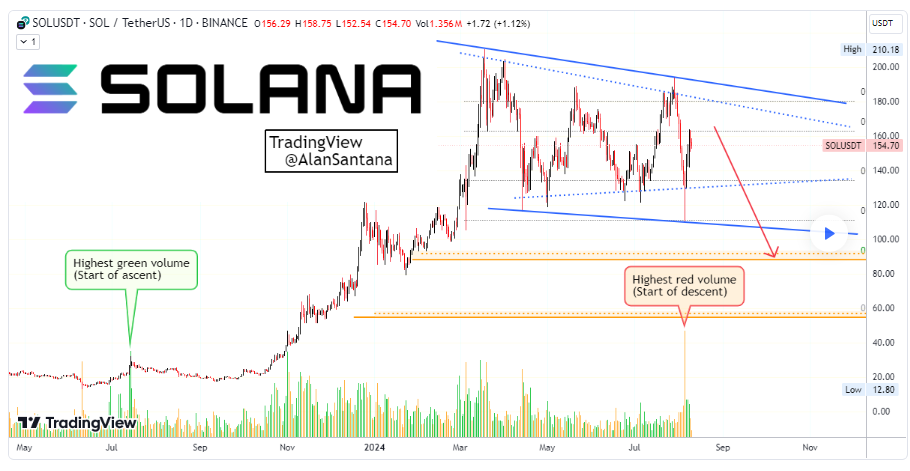
In a TradingView post on August 10, Santana pointed out that Solana’s recent price and volume patterns bear a striking resemblance to those observed in July 2023.

Solana price analysis. Source: TradingView/ Alan Sanatana
A year later, the analyst observed that the situation appears to have reversed. In August 2024, after 140 days of bearish price action, Solana showed a strong bearish volume spike. This movement suggests the continuation of the current downtrend, and the price action aligns with this bearish signal.
The analysis indicates that if this bearish momentum continues, Solana could be headed toward the $90 level—a significant support zone based on past trading activity. The coming days will be crucial in determining whether Solana can stabilize or if a further drop to $90 is on the horizon.
Solana’s potential to rally
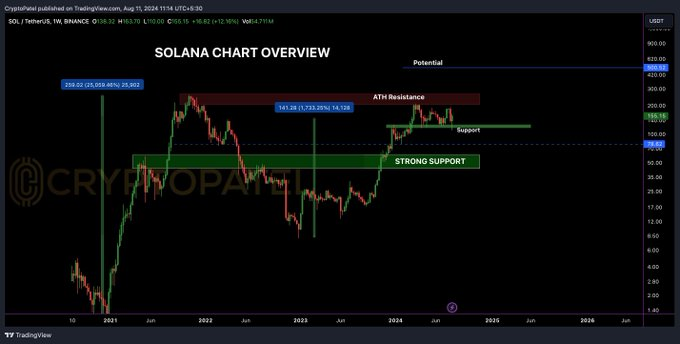
Although the volume around Solana points to bearish sentiments, another analyst has suggested that investors should anticipate a possible breakout in the price. Particularly, in an X post on August 11, the analyst by the pseudonym Crypto Patel pointed out that Solana has been exhibiting strong bullish momentum, pointing to a potential all-time high of $500 on the horizon.
According to the expert, historical performance shows that SOL has demonstrated substantial gains in past bull runs, with significant price increases from its support levels. The chart indicates a robust support zone around $80, which has historically served as a springboard for upward price movements.

Solana price analysis chart. Source: TradingView
Solana price analysis
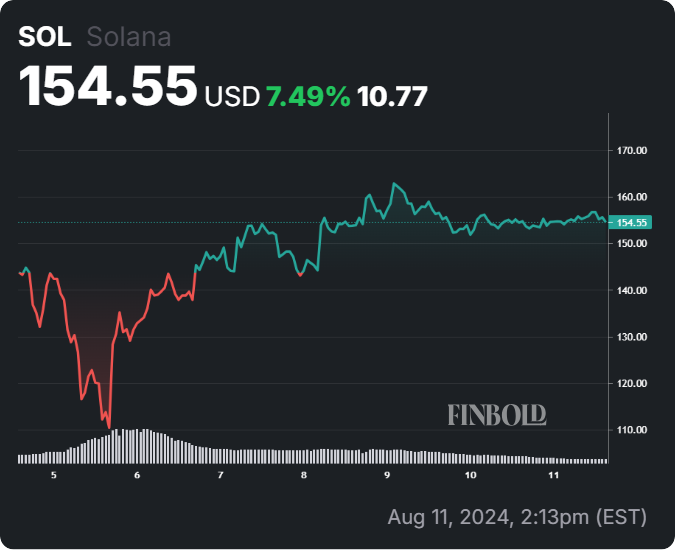
By press time, Solana was trading at $154, having corrected by about 0.3% in the last 24 hours. On the weekly chart, the asset has gained by over 7%.

Solana seven-day price chart. Source: Finbold
At the moment, investors need to watch Solana’s key support levels to alleviate any possible downturn. $150 is the major support, and dropping below this mark could spell more trouble for SOL.
Disclaimer: The content on this site should not be considered investment advice. Investing is speculative. When investing, your capital is at risk.


