In the aftermath of the United States Consumer Price Index release, Bitcoin (BTC) experienced a sharp correction, but analysts are maintaining a long-term bullish outlook.
Particularly, crypto trading expert Trading Shot, in an August 14 TradingView post, suggested that technical indicators and historical price movements point to Bitcoin possibly reaching a record high of $300,000.
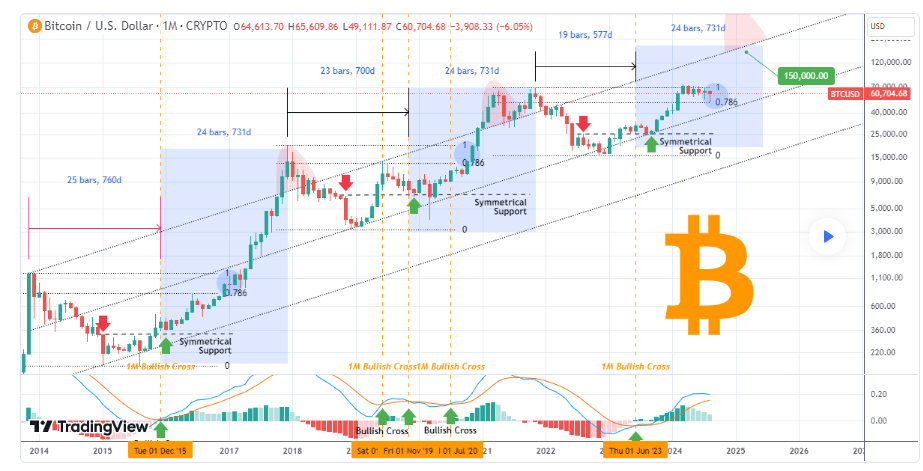
In arriving at this potential price target, the expert noted that in July 2024, Bitcoin closed in the green zone. Despite a sharp drop at the start of August, the market quickly rebounded, demonstrating strong buying power.

Bitcoin price analysis chart. Source: TradingView/Trading Shot
Central to this analysis is the bullish cross observed in the Moving Average Convergence Divergence (MACD) indicator on the one-month timeframe. According to Trading Shot, this formation has appeared only five times over the past decade, each during a bull cycle. The most recent bullish cross in June 2023 sparked a significant rally, marking the first major upswing of the current cycle.
Historical data also shows that these bullish crosses often precede significant peaks in Bitcoin’s price. For instance, the trend observed in November 2019 and December 2015 was followed by new peaks precisely 24 months later. With the June 2023 cross occurring 19 months after the last cycle’s high, the expert suggested that Bitcoin could reach its next peak around June 2025.
Bitcoin’s price next record high
The current market phase also mirrors previous consolidation periods observed in November 2020 and February 2017. Both periods saw consolidation above the 0.786 Fibonacci level, followed by bullish breakouts that led to the second major rally of their respective bull cycles.
Therefore, leveraging a long-term channel-up pattern that has been forming since 2014, Trading Shot predicted that Bitcoin could reach a price between $200,000 and $300,000. This projection is based on historical cycle highs, which have consistently occurred above this channel.
“If we were to make a rough projection on that high, we can look into the Channel Up since 2014. That pattern formed the Cycle Highs above it every time (red arcs), so technically we could be looking at values between 200k – 300k,” the expert stated.
Even with a more conservative estimate, assuming Bitcoin reaches only the top of the symmetrical support at $120,000, the cryptocurrency could still hit a price as high as $150,000. According to the expert, this would be an ideal level for investors to consider taking long-term profits.
Bitcoin investors turn to ‘HODL’
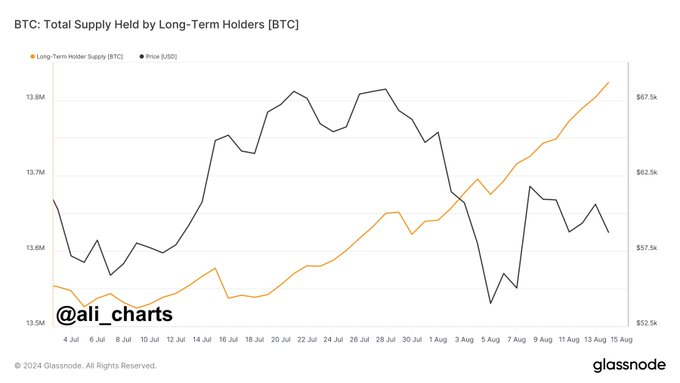
Elsewhere, Bitcoin holders appear to be maintaining their positions in the cryptocurrency to achieve long-term gains. Notably, data shared by crypto analyst Ali Martinez in an X post on August 15 highlighted that Bitcoin investors seem to be shifting from distribution to holding their assets for the long term.
Martinez shared data from crypto analysis platform Glassnode indicating that over the past three months, nearly 300,000 BTC have been added to long-term holdings, reflecting growing confidence in Bitcoin’s future potential. This increase has coincided with a period of high volatility, with more investors opting for the “HODL” strategy.

Bitcoin’s total supply by long term holders. Source: Glassnode
Bitcoin price analysis
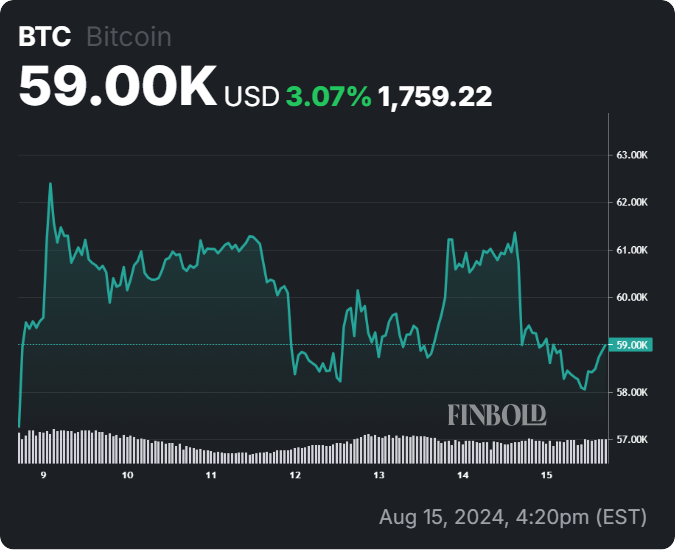
As of press time, Bitcoin was trading at $59,000, dropping almost 3% in the last 24 hours. BTC is in the green on the weekly timeframe, gaining over 3%.

Bitcoin seven-day price chart. Source: Finbold
In the meantime, with Bitcoin showing bearish sentiments, the downward pressure will likely be confirmed if it fails to break past the $60,000 resistance.
Disclaimer:The content on this site should not be considered investment advice. Investing is speculative. When investing, your capital is at risk.


